Energizer 2007 Annual Report Download - page 4
Download and view the complete annual report
Please find page 4 of the 2007 Energizer annual report below. You can navigate through the pages in the report by either clicking on the pages listed below, or by using the keyword search tool below to find specific information within the annual report.-
 1
1 -
 2
2 -
 3
3 -
 4
4 -
 5
5 -
 6
6 -
 7
7 -
 8
8 -
 9
9 -
 10
10 -
 11
11 -
 12
12 -
 13
13 -
 14
14 -
 15
15 -
16
-
17
-
18
-
19
-
20
-
21
-
22
-
23
-
24
-
25
-
26
-
27
-
28
-
29
-
30
-
31
-
32
-
33
-
34
-
35
-
36
-
37
-
38
-
39
-
40
-
41
-
42
-
43
-
44
-
45
-
46
-
47
 |
 |
2
Energizer Holdings, Inc. 2007 Annual Report
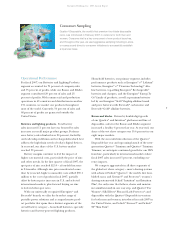
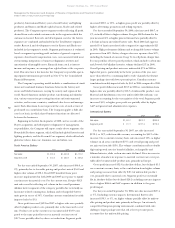
Non-GAAP Financial Presentation
In addition to its earnings presented in accordance with generally accepted accounting principles (GAAP), Energizer has presented certain non-GAAP earnings in the table above
which it believes are useful to readers in addition to traditional GAAP measures. These measures should not be considered as an alternative to comparable GAAP measures.
(a) In 2003, earnings are presented with and without the impact of a write-up recorded on inventory acquired through the purchase of Schick-Wilkinson Sword (SWS) from Pfizer.
GAAP requires inventory to be valued as if Energizer was a distributor purchasing the inventory at fair market value, as opposed to its historical manufacturing cost. As a result,
there was a one-time allocation of purchase price to the acquired inventory which was $89.7 million, pre-tax, or $58.3 million, after tax, higher than historical manufacturing
cost. Because inventory value and cost of product sold for all product manufactured after the acquisition date are based upon actual production costs, as dictated by GAAP,
Energizer believes presenting earnings excluding the inventory write-up is useful to investors as an additional basis for comparison to prior and subsequent periods.
(b) Free cash flow is defined as net cash provided by operating activities net of additions to and disposals of property, plant and equipment. The Company views free cash flow as
an important indicator of its ability to repay debt, fund growth and return cash to shareholders. Free cash flow is not a measure of the residual cash flow that is available for
discretionary expenditures, since the Company has certain non-discretionary obligations, such as debt service, that are not deducted from the measure. For April 1, 2000 to
September 30, 2007, cumulative cash flow and capital expenditures were $2.67 billion and ($0.64) billion, respectively. Cumulative free cash flow for the period April 1, 2000 to
September 30, 2007 was $2.03 billion.
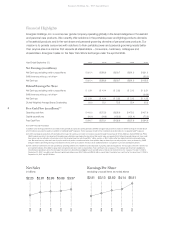
Year Ended September 30, 2007 2006 2005 2004 2003
Net Earnings (in millions)
Net Earnings, excluding certain unusual items $ 321.4 $ 260.9 $ 280.7 $ 261.0 $ 221.8
SWS inventory write-up, net of tax(a) (58.3)
Net Earnings $ 321.4 $ 260.9 $ 280.7 $ 261.0 $ 163.5
Diluted Earnings Per Share
Net Earnings, excluding certain unusual items $ 5.51 $ 4.14 $ 3.82 $ 3.13 $ 2.51
SWS inventory write-up, net of tax(a) (0.66)
Net Earnings $ 5.51 $ 4.14 $ 3.82 $ 3.13 $ 1.85
Diluted Weighted-Average Shares Outstanding 58.3 63.1 73.5 83.4 88.2
Free Cash Flow (in millions)(b)
Operating cash flow $ 445.3 $ 373.0 $ 295.9 $ 479.3 $ 437.9
Capital expenditures (88.6) (94.9) (103.0) (121.4) (73.0)
Free Cash Flow $ 356.7 $ 278.1 $ 192.9 $ 357.9 $ 364.9
Financial Highlights
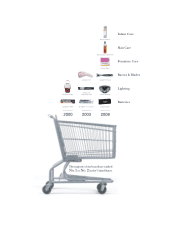
Energizer Holdings, Inc. is a consumer goods company operating globally in the broad categories of household
and personal care products. We currently offer solutions in the portable power and lighting products domains
of household products and in the wet shave and personal grooming domains of personal care products. Our
mission is to provide consumers with solutions to their portable power and personal grooming needs better
than anyone else in a manner that rewards all stakeholders – consumers, customers, colleagues and
shareholders. Energizer trades on the New York Stock Exchange under the symbol ENR.
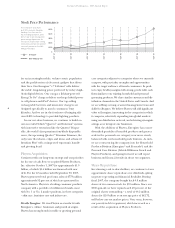
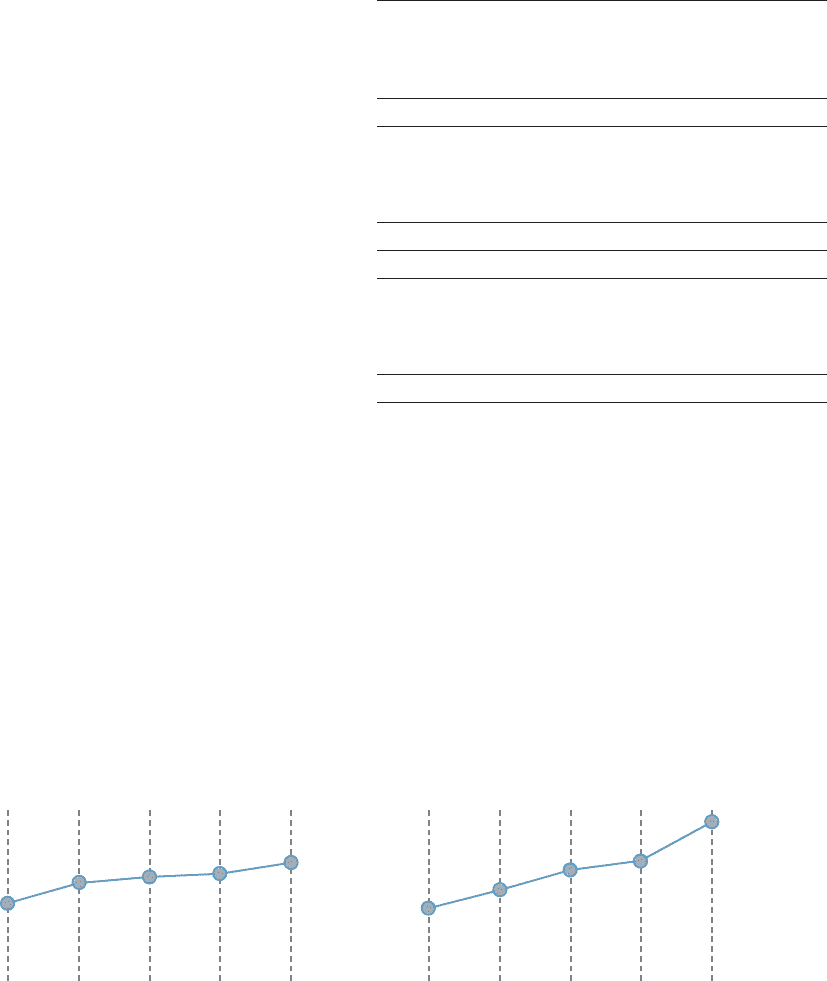
Earnings Per Share
excluding unusual items as noted above
$2.51 $3.13 $3.82 $4.14 $5.51
Net Sales
in billions
$2.23 $2.99 $3.08 $3.37
2003
2004
2005
2006
2007
2003
2004
2005
2006
2007
$2.81