Energizer 2007 Annual Report Download - page 26
Download and view the complete annual report
Please find page 26 of the 2007 Energizer annual report below. You can navigate through the pages in the report by either clicking on the pages listed below, or by using the keyword search tool below to find specific information within the annual report.-
 1
1 -
2
-
3
-
4
-
5
-
6
-
7
-
8
-
9
-
10
-
11
-
12
-
13
-
14
-
15
-
 16
16 -
 17
17 -
 18
18 -
 19
19 -
 20
20 -
 21
21 -
 22
22 -
 23
23 -
 24
24 -
 25
25 -
 26
26 -
 27
27 -
 28
28 -
 29
29 -
 30
30 -
 31
31 -
 32
32 -
 33
33 -
 34
34 -
 35
35 -
 36
36 -
37
-
38
-
39
-
40
-
41
-
42
-
43
-
44
-
45
-
46
-
47
 |
 |

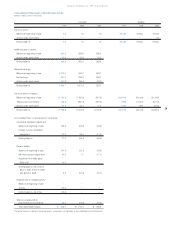
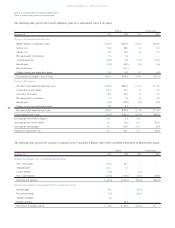
24
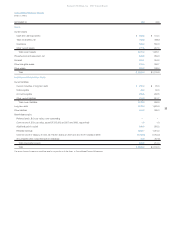
Energizer Holdings, Inc. 2007 Annual Report
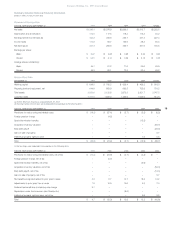
YEAR ENDED SEPTEMBER 30, 2007 2006 2005
Cash Flow from Operations
Net earnings $ 321.4 $ 260.9 $ 280.7
Adjustments to reconcile net earnings to net cash flow from operations:
Depreciation and amortization 115.0 117.5 116.3
Deferred income taxes (28.6) (23.3) (15.6)
Other non-cash charges 41.8 25.4 14.9
Other, net 7.7 11.0 4.8
Operating cash flow before changes in working capital 457.3 391.5 401.1
Changes in assets and liabilities used in operations:
Increase in accounts receivable, net (41.6) (15.0) (46.0)
Increase in inventories (7.1) (54.2) (30.3)
(Increase)/decrease in other current assets 5.9 5.8 (10.8)
Increase/(decrease) in accounts payable 4.2 11.5 (10.4)
Increase/(decrease) in other current liabilities 26.6 33.4 (7.7)
Net cash flow from operations 445.3 373.0 295.9
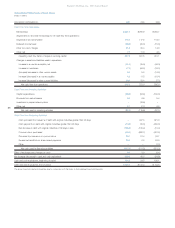
Cash Flow from Investing Activities
Capital expenditures (88.6) (94.9) (103.0)
Proceeds from sale of assets 3.6 6.6 5.4
Investment in prepaid share options –(19.6) –
Other, net 2.7 (7.7) 0.5
Net cash used by investing activities (82.3) (115.6) (97.1)
Cash Flow from Financing Activities
Cash proceeds from issuance of debt with original maturities greater than 90 days –497.8 621.0
Cash payments on debt with original maturities greater than 90 days (10.0) (15.0) (430.0)
Net decrease in debt with original maturities of 90 days or less (146.3) (123.2) (10.4)
Common stock purchased (53.0) (600.7) (461.2)
Proceeds from issuance of common stock 35.7 21.4 39.7
Excess tax benefits from share-based payments 36.2 8.2 20.9
Other –– (1.3)
Net cash used by financing activities (137.4) (211.5) (221.3)
Effect of exchange rate changes on cash 3.3 3.9 (2.1)
Net increase/(decrease) in cash and cash equivalents 228.9 49.8 (24.6)
Cash and cash equivalents, beginning of period 134.3 84.5 109.1
Cash and cash equivalents, end of period $ 363.2 $ 134.3 $ 84.5
The above financial statement should be read in conjunction with the Notes to Consolidated Financial Statements.
Consolidated Statements of Cash Flows
(Dollars in millions)