Energizer 2007 Annual Report Download - page 16
Download and view the complete annual report
Please find page 16 of the 2007 Energizer annual report below. You can navigate through the pages in the report by either clicking on the pages listed below, or by using the keyword search tool below to find specific information within the annual report.-
 1
1 -
2
-
3
-
4
-
5
-
 6
6 -
 7
7 -
 8
8 -
 9
9 -
 10
10 -
 11
11 -
 12
12 -
 13
13 -
 14
14 -
 15
15 -
 16
16 -
 17
17 -
 18
18 -
 19
19 -
 20
20 -
 21
21 -
 22
22 -
 23
23 -
 24
24 -
 25
25 -
 26
26 -
27
-
28
-
29
-
30
-
31
-
32
-
33
-
34
-
35
-
36
-
37
-
38
-
39
-
40
-
41
-
42
-
43
-
44
-
45
-
46
-
47
 |
 |

14
Energizer Holdings, Inc. 2007 Annual Report
Other financing expense was favorable $15.8 in 2007 compared to
2006 due to higher interest income of $11.0 and currency exchange
gains in 2007 compared to currency exchange losses in 2006. Other
financing expense was unfavorable $3.6 in 2006 compared to 2005,
primarily due to lower currency exchange losses.
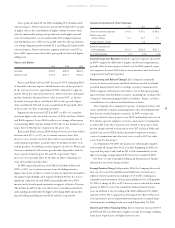
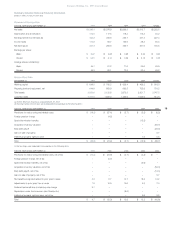
Income Taxes Income taxes, which include federal, state and for-
eign taxes, were 26.0%, 26.8% and 27.8% of earnings before
income taxes in 2007, 2006 and 2005, respectively. Income taxes
include the following items which impact the overall tax rate:
In 2007, 2006 and 2005, $4.3, $5.7 and $14.7, respectively, of tax ben-
efits related to prior years’ losses were recorded. These benefits
related to foreign countries where our subsidiary subsequently began
to generate earnings and could reasonably expect future profitability
sufficient to utilize tax loss carry-forwards prior to expiration.
Improved profitability in Mexico in 2007 and 2006 and Germany in
2005 account for the bulk of the benefits recognized.
Legislation enacted in Germany in August 2007 reduced the tax rate
applicable to the Company’s subsidiaries in Germany for fiscal 2008
and beyond. Thus an adjustment of $9.7 was made to reduce
deferred tax liabilities in fiscal 2007.
Adjustments were recorded in each of the three years to revise previ-
ously recorded tax accruals to reflect refinement of estimates of tax
attributes to amounts in filed returns, settlement of tax audits and
changes in estimates related to uncertain tax positions in a number
of jurisdictions. Such adjustments decreased the income tax provision
by $7.9, $10.9 and $10.6 in 2007, 2006 and 2005, respectively.
2005 included $9.0 of additional taxes related to repatriation of for-
eign earnings under provisions of the American Jobs Creation Act,
which provided for an 85% exclusion of qualifying dividends from
normal U.S. tax rates.
Excluding the items discussed above, the income tax percentage was
31.0% in 2007, 31.5% in 2006 and 32.0% in 2005.
The Company’s effective tax rate is highly sensitive to country mix
from which earnings or losses are derived. Declines in earnings in
lower tax rate countries, earnings increases in higher tax countries,
increases in repatriation of foreign earnings or operating losses in the
future could increase future tax rates. Additionally, adjustments to
prior year tax accrual estimates could increase or decrease future tax
provisions.
Liquidity and Capital Resources
Operating Activities Cash flow from operations is the primary fund-
ing source for operating needs and capital investments. Cash flow
from operations was $445.3 in 2007, an increase of $72.3 from 2006
due to improved operating cash flow before changes in working capi-
tal. Cash flow from operations was $373.0 in 2006, an increase of
$77.1 from 2005, primarily on lower net working capital investment
in 2006.
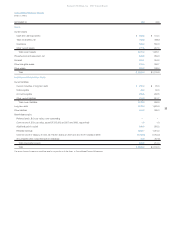
Working capital, which is defined as current assets less current
liabilities, was $888.5 and $708.2 at September 30, 2007 and 2006,
respectively. Working capital changes reflect higher current assets,
partially offset by higher short-term debt and other current liabili-
ties. Accounts receivable increased on higher sales and timing of
end of year volume and promotional structure. Inventories
increased primarily due to higher material costs. Other current
liabilities reflect higher accrued advertising, promotion and
allowances for both businesses.
Investing Activities Net cash used by investing activities was $82.3,
$115.6 and $97.1 in 2007, 2006 and 2005, respectively. The Company
made an investment in its prepaid share options (PSO) of $19.6 in
2006. See Note 13 for further discussion on the PSO. Capital expen-
ditures were $88.6, $94.9 and $103.0 in 2007, 2006 and 2005, respec-
tively. These expenditures were funded by cash flow from operations.
Capital expenditures decreased in 2007 due to lower information sys-
tems capital spending. See Note 17 of the Consolidated Financial
Statements for capital expenditures by segment. On October 1, 2007,
the Company paid approximately $1,900 for the acquisition of all out-
standing Playtex common stock, repayment or defeasance of out-
standing Playtex debt, and other transaction costs. See Financing
Activities below for discussion of financing of the transaction.
Capital expenditures of approximately $185 are anticipated in
2008 with increases in production related capital for existing busi-
nesses and planned spending for Playtex. Such capital expenditures
are expected to be financed with funds generated from operations.
Financing Activities The Company’s total borrowings were $1,625.0
at September 30, 2007. The Company maintained total committed
debt facilities of $2,140.0, of which $558.0 was available as of
September 30, 2007.
In October 2007, the Company borrowed approximately $1,500
under a bridge loan facility which, together with cash on hand was
used to acquire Playtex. The Company subsequently refinanced $890
of the bridge loan with long-term debt financing, with maturities
ranging from three to 10 years and fixed rates ranging from 5.71% to
6.55%. The Company expects to replace the remaining outstanding
bridge loan with permanent financing during the December quarter.
As a result of the new financing arrangement, total outstanding debt
in October was approximately $3,300 and the Company currently has
$387.0 of additional available committed debt facilities to meet its
ongoing liquidity needs.
Under the terms of the Company’s debt facilities, the ratio of the
Company’s indebtedness to its Earnings Before Interest, Taxes,
Depreciation and Amortization (EBITDA) cannot be greater than
4.0 to 1, and may not remain above 3.5 to 1 for more than four con-
secutive quarters. In addition, the ratio of its current year EBIT to
total interest expense must exceed 3.0 to 1. The Company’s ratio of
indebtedness to its EBITDA was 2.5 to 1, and the ratio of its EBIT to
total interest expense was 5.9 to 1 as of September 30, 2007. Failure
to comply with the above ratios or other covenants could result in
acceleration of maturity, which could trigger cross defaults on other
borrowings. The Company believes that covenant violations resulting
in acceleration of maturity is unlikely. The Company’s fixed rate debt
Management’s Discussion and Analysis of Results of Operations and Financial Condition
(Dollars in millions, except per share and percentage data)