Energizer 2007 Annual Report Download - page 13
Download and view the complete annual report
Please find page 13 of the 2007 Energizer annual report below. You can navigate through the pages in the report by either clicking on the pages listed below, or by using the keyword search tool below to find specific information within the annual report.-
 1
1 -
2
-
 3
3 -
 4
4 -
 5
5 -
 6
6 -
 7
7 -
 8
8 -
 9
9 -
 10
10 -
 11
11 -
 12
12 -
 13
13 -
 14
14 -
 15
15 -
 16
16 -
 17
17 -
 18
18 -
 19
19 -
 20
20 -
 21
21 -
 22
22 -
 23
23 -
24
-
25
-
26
-
27
-
28
-
29
-
30
-
31
-
32
-
33
-
34
-
35
-
36
-
37
-
38
-
39
-
40
-
41
-
42
-
43
-
44
-
45
-
46
-
47
 |
 |

11
Energizer Holdings, Inc. 2007 Annual Report
U.S. Playtex is a leading North American manufacturer and marketer
in the skin, feminine and infant care industries, with a diversified
portfolio of well-recognized branded consumer products.
As a result of the Playtex acquisition, the Company’s total debt is
just under $3,300 with a blended interest rate of 5.6%. We expect
our future effective tax rate to be approximately one percentage point
higher as a result of the Playtex acquisition. This increase reflects the
concentration of Playtex profits in the U.S., which has a higher tax
rate than our historical average. In addition to the other impacts from
the Playtex acquisition, our results for the December and March
quarters will be negatively impacted by an inventory write-up necessary
under purchase accounting rules. The Company will begin reporting
results of Playtex operations as of the beginning of fiscal 2008.
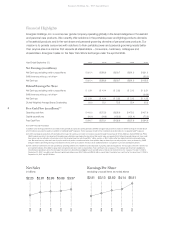
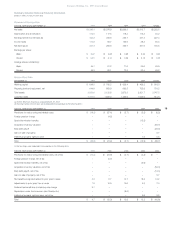
Financial Results
Net earnings for the year ended September 30, 2007 were $321.4
compared to $260.9 in 2006 and $280.7 in 2005. Basic and diluted
earnings per share in 2007 were $5.67 and $5.51, respectively, com-
pared to $4.26 and $4.14 in 2006 and $3.95 and $3.82 in 2005.
Current year net earnings include the following items, stated
on an after-tax basis:
favorable adjustments to deferred tax balances and prior years’ tax
accruals and previously unrecognized tax benefits related to foreign
losses of $21.9, or $0.37 per diluted share, partially offset by
charges of $12.2, or $0.21 per diluted share, related to European
restructuring programs.
Fiscal 2006 net earnings included the following items, stated on
an after-tax basis:
charges of $24.9, or $0.39 per diluted share, related to European
restructuring programs,
a charge of $3.7, or $0.06 per diluted share, to record the cumulative
amount of foreign pension costs that should have been previously
recognized and
favorable adjustments to prior years’ tax accruals and previously
unrecognized tax benefits related to foreign losses of $16.6,
or $0.26 per diluted share.
Fiscal 2005 net earnings included the following, stated on
an after-tax basis:
tax benefits totaling $25.3, or $0.34 per diluted share, related
to tax loss benefits and adjustments to prior year tax accruals,
partially offset by,
a $9.0, or $0.12 per diluted share, provision related to repatriation of
foreign earnings under the American Jobs Creation Act and
restructuring charges of $3.7, or $0.05 per diluted share, related to
several individually immaterial restructuring projects.
Operating Results
Net Sales Net sales in 2007 increased $288.2, or 9%, in absolute
dollars, or $212.7, or 7%, on a constant currency basis compared to
2006. All three segments contributed to the increase. Net sales in
2006 increased $87.1, or 3%, in absolute dollars and $110.4, or 4%,
on a constant currency basis compared to 2005. Both the North
America and International Battery segments accounted for the 2006
increased absolute dollar sales while the Razors and Blades segment
sales were flat in absolute dollars and up 2% on a constant currency
basis. See Segment Results below for additional discussion of
sales changes.
Gross Profit Gross profit dollars increased $123.9 in 2007 with
increases in all three segments. The 2007 increase includes favorable
currency of $58.0. In 2006, gross profit dollars increased $3.1 prima-
rily on increases in the Razors and Blades and North America Battery
segments, partially offset by a decline in the International Battery
segment.
Gross margin percentage was 47.7% of sales in 2007, 48.1% in
2006 and 49.4% in 2005. The margin percentage decline in 2007 is
primarily due to lower margin in our International Battery segment.
The margin percentage decline in 2006 reflects lower profit percent-
age in both battery segments, partially offset by an increase in the
Razors and Blades segment. Higher material costs were the primary
factor in battery gross margin percentage declines in both years.
See Segment Results for a discussion of gross profit in each
operating segment.
Selling, General and Administrative Selling, general and administra-
tive expense (SG&A) increased $26.0 in 2007 due to currency
impacts of $15.0 and higher spending in the battery businesses, par-
tially offset by lower restructuring charges. In 2006, SG&A increased
$20.5 due to higher restructuring charges, and to a lesser extent,
increases in each segment.
SG&A expenses were 18.7%, 19.6% and 19.4% of sales in 2007,
2006 and 2005, respectively. The decline in 2007 was driven by the
lower restructuring charges and lower spending as a percent of sales
in the razors and blades business.
Advertising and Promotion Advertising and promotion (A&P)
increased $26.3 in 2007 with increased spending in both battery seg-
ments and currency impacts of $9.6. A&P decreased $18.7 in 2006 on
lower spending in the International Battery and Razors and Blades
segments.
A&P expense was 11.7%, 12.0% and 13.0% of sales for 2007, 2006
and 2005, respectively. A&P expense can vary from year to year with
new product launches, strategic brand support initiatives and the
overall competitive environment.
Research and Development Research and development (R&D)
expense was $70.7 in 2007, $74.2 in 2006 and $69.9 in 2005. The
expense in 2006 includes a $4.6 increase in the Razors and Blades
segment primarily related to a discrete R&D project. As a percent of
sales, R&D expense was 2.1% in 2007, 2.4% in 2006 and 2.3% in 2005.
Segment Results
Operations for the Company are managed via three major segments
– North America Battery (U.S. and Canada battery and lighting