Dollar Tree 2008 Annual Report Download - page 48
Download and view the complete annual report
Please find page 48 of the 2008 Dollar Tree annual report below. You can navigate through the pages in the report by either clicking on the pages listed below, or by using the keyword search tool below to find specific information within the annual report.-
 1
1 -
2
-
3
-
4
-
5
-
6
-
7
-
8
-
9
-
10
-
11
-
12
-
13
-
14
-
15
-
16
-
17
-
18
-
19
-
20
-
21
-
22
-
23
-
24
-
25
-
26
-
27
-
28
-
29
-
30
-
31
-
32
-
33
-
34
-
35
-
36
-
37
-
 38
38 -
 39
39 -
 40
40 -
 41
41 -
 42
42 -
 43
43 -
 44
44 -
 45
45 -
 46
46 -
 47
47 -
 48
48 -
 49
49 -
 50
50 -
 51
51 -
 52
52
 |
 |

46
DOLLAR TREE, INC. • 2008 ANNUAL REPORT
Notes to Consolidated Financial Statements continued
In 2008, the Company granted 0.1 million RSUs
from the EIP and the EOEP to certain officers of the
Company, contingent on the Company meeting cer-
tain performance targets in 2008 and future service of
these officers through fiscal 2009. The Company met
these performance targets in fiscal 2008; therefore, the
fair value of these RSUs of $2.3 million is being
expensed over the service period. The Company rec-
ognized $1.2 million of expense on these RSUs in
2008. The fair value of these RSUs was determined
using the Company’s closing stock price on the grant
date in accordance with FAS 123R.
In 2006, the Company granted less than 0.1 mil-
lion RSUs from the EOEP and the EIP to certain offi-
cers of the Company, contingent on the Company
meeting certain performance targets in 2006 and
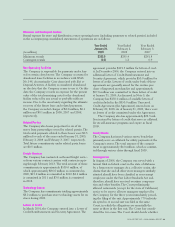
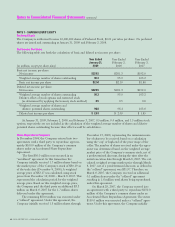
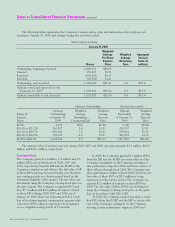
The following tables summarize the Company's various option plans and information about options out-
standing at January 31, 2009 and changes during the year then ended.
Stock Option Activity
January 31, 2009
Weighted
Average Weighted Aggregate
Per Share Average Intrinsic
Exercise Remaining Value (in
Shares Price Term millions)
Outstanding, beginning of period 2,089,914 $28.63
Granted 558,293 28.51
Exercised (681,609) 26.47
Forfeited (23,982) 24.41
Outstanding, end of period 1,942,616 $29.41 6.4 $25.8
Options vested and expected to vest
at January 31, 2009 1,909,041 $29.44 6.3 $25.3
Options exercisable at end of period 1,097,837 $28.46 4.6 $15.6
Options Outstanding Options Exercisable
Options Weighted Weighted Options Weighted
Range of Outstanding Average Average Exercisable Average
Exercise at January 31, Remaining Exercise at January 31, Exercise
Prices 2009 Contractual Life Price 2009 Price
$0.86 2,076 N/A $0.86 2,706 $0.86
$10.99 to $21.28 216,387 3.6 19.51 216,387 19.51
$21.29 to $29.79 930,425 7.2 26.21 379.491 25.52
$29.80 to $42.56 793,098 6.0 35.97 499,253 34.73
$0.86 to $42.56 1,942,616 6.4 $29.41 1,097,837 $28.46
The intrinsic value of options exercised during 2008, 2007 and 2006 was approximately $7.2 million, $32.8
million and $13.1 million, respectively.
Restricted Stock
The Company granted 0.4 million, 0.3 million and 0.3
million RSUs, net of forfeitures in 2008, 2007 and
2006, respectively, from the EIP and the EOEP to the
Company’s employees and officers. The fair value of all
of these RSUs is being expensed ratably over the three-
year vesting periods, or a shorter period based on the
retirement eligibility of the grantee. The fair value was
determined using the Company’s closing stock price on
the date of grant. The Company recognized $9.5 mil-
lion, $7.7 million and $4.5 million of expense related
to these RSUs during 2008, 2007 and 2006. As of
January 31, 2009, there was approximately $11.9 mil-
lion of total unrecognized compensation expense relat-
ed to these RSUs which is expected to be recognized
over a weighted average period of 21 months.