Dollar Tree 2008 Annual Report Download - page 21
Download and view the complete annual report
Please find page 21 of the 2008 Dollar Tree annual report below. You can navigate through the pages in the report by either clicking on the pages listed below, or by using the keyword search tool below to find specific information within the annual report.-
 1
1 -
2
-
3
-
4
-
5
-
6
-
7
-
8
-
9
-
10
-
 11
11 -
 12
12 -
 13
13 -
 14
14 -
 15
15 -
 16
16 -
 17
17 -
 18
18 -
 19
19 -
 20
20 -
 21
21 -
 22
22 -
 23
23 -
 24
24 -
 25
25 -
 26
26 -
 27
27 -
 28
28 -
 29
29 -
 30
30 -
 31
31 -
32
-
33
-
34
-
35
-
36
-
37
-
38
-
39
-
40
-
41
-
42
-
43
-
44
-
45
-
46
-
47
-
48
-
49
-
50
-
51
-
52
 |
 |

DOLLAR TREE, INC. • 2008 ANNUAL REPORT
19
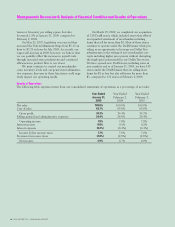
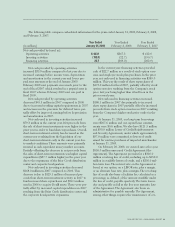
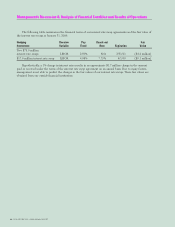
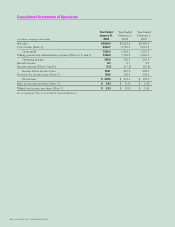
The following table compares cash-related information for the years ended January 31, 2009, February 2, 2008,
and February 3, 2007:
Year Ended Year Ended Year Ended
(in millions) January 31, 2009 February 2, 2008 February 3, 2007
Net cash provided by (used in):
Operating activities $ 403.1 $367.3 $ 412.8
Investing activities (102.0) (22.7) (190.7)
Financing activities 22.7 (389.0) (202.9)
Net cash provided by operating activities
increased $35.8 million compared to last year due to
increased earnings before income taxes, depreciation
and amortization in the current year and lower pre-
paid rent amounts at the end of January 2009.
February 2008 rent payments were made prior to the
end of fiscal 2007 which resulted in a prepaid asset in
fiscal 2007 whereas February 2009 rent was paid in
fiscal 2009.
Net cash provided by operating activities
decreased $45.5 million in 2007 compared to 2006
due to increased working capital requirements in 2007
and increases in the provision for deferred taxes, par-
tially offset by improved earnings before depreciation
and amortization in 2007.
Net cash used in investing activities increased
$79.3 million in the current year. Net proceeds from
the sale of short-term investments were higher in the
prior year in order to fund share repurchases. Overall,
short-term investment activity has decreased in the
current year resulting from the liquidation of our
short-term investments early in the current year due
to market conditions. These amounts were primarily
invested in cash equivalent money market accounts.
Partially offsetting the decrease in net proceeds from
the sales of short-term investments was higher capital
expenditures ($57.7 million higher) in the prior year
due to the expansions of the Briar Creek distribution
center and corporate headquarters.
Net cash used in investing activities decreased
$168.0 million in 2007 compared to 2006. This
decrease is due to $129.1 million of increased pro-
ceeds from short-term investment activity in 2007 to
fund increased share repurchases and $54.1 million
used in 2006 to acquire Deal$ assets. These were par-
tially offset by increased capital expenditures in 2007
resulting from the Briar Creek distribution center and
the corporate headquarters expansions.
In the current year, financing activities provided
cash of $22.7 million as a result of stock option exer-
cises and employee stock plan purchases. In the prior
year, net cash used in financing activities was $389.0
million. This was the result of share repurchases of
$473.0 million for fiscal 2007, partially offset by stock
option exercises resulting from the Company’s stock
price last year being higher than it had been in the
prior several years.
Net cash used in financing activities increased
$186.1 million in 2007 due primarily to increased
share repurchases in 2007 partially offset by increased
proceeds from stock option exercises in 2007 resulting
from the Company’s higher stock price earlier in the
year.
At January 31, 2009, our long-term borrowings
were $267.6 million and our capital lease commit-
ments were $0.6 million. We also have $121.5 million
and $50.0 million Letter of Credit Reimbursement
and Security Agreements, under which approximately
$97.8 million were committed to letters of credit
issued for routine purchases of imported merchandise
at January 31, 2009.
On February 20, 2008, we entered into a five-year
$550.0 million unsecured Credit Agreement (the
Agreement). The Agreement provides for a $300.0
million revolving line of credit, including up to $150.0
million in available letters of credit, and a $250.0 mil-
lion term loan. The interest rate on the Agreement is
based, at our option, on a LIBOR rate, plus a margin,
or an alternate base rate, plus a margin. The revolving
line of credit also bears a facilities fee, calculated as a
percentage, as defined, of the amount available under
the line of credit, payable quarterly. The term loan is
due and payable in full at the five year maturity date
of the Agreement. The Agreement also bears an
administrative fee payable annually. The Agreement,
among other things, requires the maintenance of cer-