Dollar Tree 2008 Annual Report Download - page 39
Download and view the complete annual report
Please find page 39 of the 2008 Dollar Tree annual report below. You can navigate through the pages in the report by either clicking on the pages listed below, or by using the keyword search tool below to find specific information within the annual report.-
 1
1 -
2
-
3
-
4
-
5
-
6
-
7
-
8
-
9
-
10
-
11
-
12
-
13
-
14
-
15
-
16
-
17
-
18
-
19
-
20
-
21
-
22
-
23
-
24
-
25
-
26
-
27
-
28
-
 29
29 -
 30
30 -
 31
31 -
 32
32 -
 33
33 -
 34
34 -
 35
35 -
 36
36 -
 37
37 -
 38
38 -
 39
39 -
 40
40 -
 41
41 -
 42
42 -
 43
43 -
 44
44 -
 45
45 -
 46
46 -
 47
47 -
 48
48 -
 49
49 -
50
-
51
-
52
 |
 |

DOLLAR TREE, INC. • 2008 ANNUAL REPORT
37
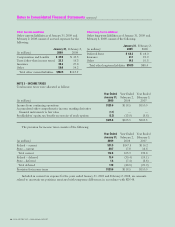
A reconciliation of the statutory federal income tax rate and the effective rate follows:
Year Ended Year Ended Year Ended
January 31, February 2, February 3,
2009 2008 2007
Statutory tax rate 35.0% 35.0% 35.0%
Effect of:
State and local income taxes, net of federal income tax benefit 3.0 2.9 3.3
Other, net (1.9) (0.8) (1.7)
Effective tax rate 36.1% 37.1% 36.6%
The rate reduction in “other, net” consists primarily of benefits from the resolution of tax uncertainties, inter-
est on tax reserves, federal jobs credits and tax exempt interest.
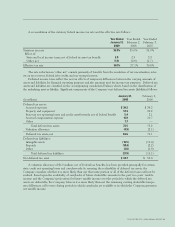
Deferred income taxes reflect the net tax effects of temporary differences between the carrying amounts of
assets and liabilities for financial reporting purposes and the amounts used for income tax purposes. Deferred tax
assets and liabilities are classified on the accompanying consolidated balance sheets based on the classification of
the underlying asset or liability. Significant components of the Company's net deferred tax assets (liabilities) follows:
January 31, February 2,
(in millions) 2009 2008
Deferred tax assets:
Accrued expenses $39.2 $ 38.2
Property and equipment 12.3 22.2
State tax net operating losses and credit carryforwards, net of federal benefit 5.4 2.1
Accrued compensation expense 14.9 10.7
Other 1.7 —
Total deferred tax assets 73.5 73.2
Valuation allowance (4.9) (2.1)
Deferred tax assets, net 68.6 71.1
Deferred tax liabilities:
Intangible assets (13.5) (11.0)
Prepaids (10.4) (2.2)
Other (4.0) (1.9)
Total deferred tax liabilities (27.9) (15.1)
Net deferred tax asset $40.7 $ 56.0
A valuation allowance of $4.9 million, net of Federal tax benefits, has been provided principally for certain
state credit net operating losses and carryforwards. In assessing the realizability of deferred tax assets, the
Company considers whether it is more likely than not that some portion or all of the deferred taxes will not be
realized. Based upon the availability of carrybacks of future deductible amounts to the past two years’ taxable
income and the Company's projections for future taxable income over the periods in which the deferred tax
assets are deductible, the Company believes it is more likely than not the remaining existing deductible tempo-
rary differences will reverse during periods in which carrybacks are available or in which the Company generates
net taxable income.