Dollar Tree 2008 Annual Report Download - page 20
Download and view the complete annual report
Please find page 20 of the 2008 Dollar Tree annual report below. You can navigate through the pages in the report by either clicking on the pages listed below, or by using the keyword search tool below to find specific information within the annual report.-
 1
1 -
2
-
3
-
4
-
5
-
6
-
7
-
8
-
9
-
 10
10 -
 11
11 -
 12
12 -
 13
13 -
 14
14 -
 15
15 -
 16
16 -
 17
17 -
 18
18 -
 19
19 -
 20
20 -
 21
21 -
 22
22 -
 23
23 -
 24
24 -
 25
25 -
 26
26 -
 27
27 -
 28
28 -
 29
29 -
 30
30 -
31
-
32
-
33
-
34
-
35
-
36
-
37
-
38
-
39
-
40
-
41
-
42
-
43
-
44
-
45
-
46
-
47
-
48
-
49
-
50
-
51
-
52
 |
 |

18
DOLLAR TREE, INC. • 2008 ANNUAL REPORT
Management’s Discussion & Analysis of Financial Condition and Results of Operations
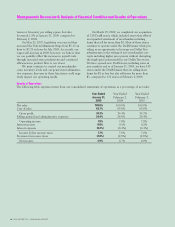
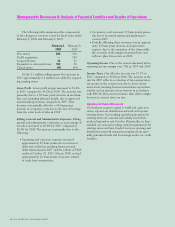
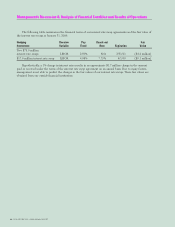
The following table summarizes the components
of the changes in our store count for fiscal years ended
February 2, 2008 and February 3, 2007.
February 2, February 3,
2008 2007
New stores 208 190
Deal$ acquisition —138
Acquired leases 32 21
Expanded or relocated stores 102 85
Closed stores (48) (44)
Of the 2.1 million selling square foot increase in
2007 approximately 0.4 million was added by expand-
ing existing stores.
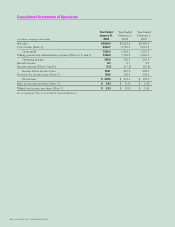
Gross Profit. Gross profit margin increased to 34.4%
in 2007 compared to 34.2% in 2006. The increase was
primarily due to a 50 basis point decrease in merchan-
dise cost, including inbound freight, due to improved
initial mark-up in many categories in 2007. This
decrease was partially offset by a 40 basis point
increase in occupancy costs due to the loss of leverage
from the extra week of sales in 2006.
Selling, General and Administrative Expenses. Selling,
general and administrative expenses, as a percentage of
net sales, increased to 26.6% for 2007 compared to
26.4% for 2006. The increase is primarily due to the
following:
• Operating and corporate expenses increased
approximately 25 basis points due to increased
debit and credit fees resulting from increased
debit transactions in 2007 and the rollout of VISA
credit at October 31, 2007. Also, in 2006, we had
approximately 10 basis points of income related
to early lease terminations.
• Occupancy costs increased 15 basis points prima-
rily due to increased repairs and maintenance
costs in 2007.
• Partially offsetting these increases was an approxi-
mate 15 basis point decrease in depreciation
expense due to the expiration of the depreciable
life on much of the supply chain hardware and
software placed in service in 2002.
Operating Income. Due to the reasons discussed above,
operating income margin was 7.8% in 2007 and 2006.
Income Taxes. Our effective tax rate was 37.1% in
2007 compared to 36.6% in 2006. The increase in the
rate for 2007 reflects a reduction of tax-exempt inter-
est income in the current year due to lower invest-
ment levels resulting from increased share repurchase
activity and an increase in tax reserves in accordance
with FIN 48. These increases more than offset a slight
decrease in our net state tax rate.
Liquidity and Capital Resources
Our business requires capital to build and open new
stores, expand our distribution network and operate
existing stores. Our working capital requirements for
existing stores are seasonal and usually reach their
peak in September and October. Historically, we have
satisfied our seasonal working capital requirements for
existing stores and have funded our store opening and
distribution network expansion programs from inter-
nally generated funds and borrowings under our credit
facilities.