Dollar Tree 2008 Annual Report Download - page 17
Download and view the complete annual report
Please find page 17 of the 2008 Dollar Tree annual report below. You can navigate through the pages in the report by either clicking on the pages listed below, or by using the keyword search tool below to find specific information within the annual report.-
 1
1 -
2
-
3
-
4
-
5
-
6
-
 7
7 -
 8
8 -
 9
9 -
 10
10 -
 11
11 -
 12
12 -
 13
13 -
 14
14 -
 15
15 -
 16
16 -
 17
17 -
 18
18 -
 19
19 -
 20
20 -
 21
21 -
 22
22 -
 23
23 -
 24
24 -
 25
25 -
 26
26 -
 27
27 -
28
-
29
-
30
-
31
-
32
-
33
-
34
-
35
-
36
-
37
-
38
-
39
-
40
-
41
-
42
-
43
-
44
-
45
-
46
-
47
-
48
-
49
-
50
-
51
-
52
 |
 |

DOLLAR TREE, INC. • 2008 ANNUAL REPORT
15
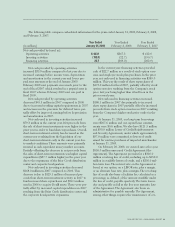
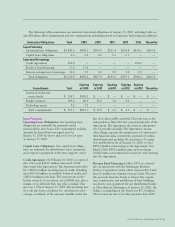
Fiscal 2006 ended on February 3, 2007 and
included 53 weeks, commensurate with the retail cal-
endar. The 53rd week in 2006 added approximately
$70 million in sales. Fiscal 2008 and 2007 ended on
January 31, 2009 and February 2, 2008, respectively,
and both years included 52 weeks.
In fiscal 2008, comparable store net sales
increased by 4.1%. The comparable store net sales
increase was the result of increases of 3.7% in the
number of transactions and a 0.4% increase in average
transaction size. We believe comparable store net sales
continue to be positively affected by a number of our
initiatives, including expansion of forms of payment
accepted by our stores and the roll-out of freezers and
coolers to more of our stores. At January 31, 2009 we
had frozen and refrigerated merchandise in approxi-
mately 1,200 stores compared to approximately 1,100
stores at February 2, 2008. We believe that this
enables us to increase sales and earnings by increasing
the number of shopping trips made by our customers
and increasing the average transaction size. In addition,
we now accept food stamps in approximately 2,200
qualified stores compared to 1,000 at the end of 2007.
Beginning October 31, 2007, all of our stores accept
Visa credit which has had a positive impact on our
sales for fiscal 2008.
With the pressures of the current economic envi-
ronment, we have seen an increase in the demand for
basic, consumable merchandise in 2008. As a result,
we have shifted the mix of inventory carried in our
stores to more consumer product merchandise which
we believe increases the traffic in our stores and has
helped to increase our sales even during the current
economic downturn. This shift has negatively impact-
ed our margins in 2008, and we believe that this
increase in basic, consumer product merchandise will
negatively impact our margins in the first half of 2009.
Our point-of-sale technology provides us with
valuable sales and inventory information to assist our
buyers and improve our merchandise allocation to our
stores. We believe that this has enabled us to better
manage our inventory flow resulting in more efficient
distribution and store operations and increased inven-
tory turnover for each of the last two years. Inventory
turnover improved by approximately 5 basis points in
2008 compared to 2007 and by approximately 25
basis points in 2007 compared to 2006. Fiscal 2008
was the fourth consecutive year of increased inventory
• In October 2007, our Board of Directors author-
ized the repurchase of an additional $500.0 mil-
lion of our common stock. This authorization was
in addition to the November 2006 authorization
which had approximately $98.4 million remaining.
At January 31, 2009, we had approximately $453.7
million remaining under Board authorizations.
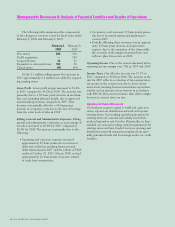
Overview
Our net sales are derived from the sale of merchan-
dise. Two major factors tend to affect our net sales
trends. First is our success at opening new stores or
adding new stores through acquisitions. Second, sales
vary at our existing stores from one year to the next.
We refer to this change as a change in comparable
store net sales, because we compare only those stores
that are open throughout both of the periods being
compared. We include sales from stores expanded dur-
ing the year in the calculation of comparable store net
sales, which has the effect of increasing our compara-
ble store net sales. The term 'expanded' also includes
stores that are relocated.
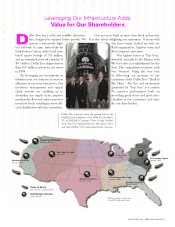
At January 31, 2009, we operated 3,591 stores in
48 states, with 30.3 million selling square feet com-
pared to 3,411 stores with 28.4 million selling square
feet at February 2, 2008. During fiscal 2008, we
opened 231 stores, expanded 86 stores and closed 51
stores, compared to 240 new stores opened, 102 stores
expanded and 48 stores closed during fiscal 2007. In
the current year we increased our selling square
footage by 6.7%. Of the 1.9 million selling square foot
increase in 2008, 0.3 million was added by expanding
existing stores. The average size of our stores opened
in 2008 was approximately 8,100 selling square feet
(or about 10,300 gross square feet). The average new
store size decreased slightly in 2008 from approxi-
mately 8,500 selling square feet (or about 10,800
gross square feet) for new stores in 2007. For 2009,
we continue to plan to open stores that are approxi-
mately 8,000–10,000 selling square feet (or about
10,000–12,000 gross square feet). We believe that this
store size is our optimal size operationally and that
this size also gives our customers an ideal shopping
environment that invites them to shop longer and buy
more. We expect the majority of our future net sales
growth to come from the square footage growth
resulting from new store openings and expansion of
existing stores.