Dollar Tree 2008 Annual Report Download - page 33
Download and view the complete annual report
Please find page 33 of the 2008 Dollar Tree annual report below. You can navigate through the pages in the report by either clicking on the pages listed below, or by using the keyword search tool below to find specific information within the annual report.-
 1
1 -
2
-
3
-
4
-
5
-
6
-
7
-
8
-
9
-
10
-
11
-
12
-
13
-
14
-
15
-
16
-
17
-
18
-
19
-
20
-
21
-
22
-
 23
23 -
 24
24 -
 25
25 -
 26
26 -
 27
27 -
 28
28 -
 29
29 -
 30
30 -
 31
31 -
 32
32 -
 33
33 -
 34
34 -
 35
35 -
 36
36 -
 37
37 -
 38
38 -
 39
39 -
 40
40 -
 41
41 -
 42
42 -
 43
43 -
44
-
45
-
46
-
47
-
48
-
49
-
50
-
51
-
52
 |
 |

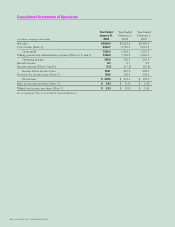
DOLLAR TREE, INC. • 2008 ANNUAL REPORT
31
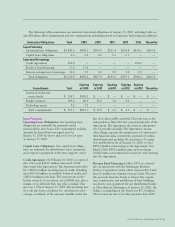
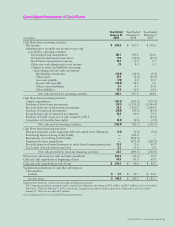
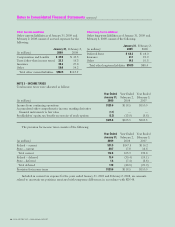
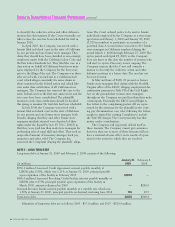
Consolidated Statements of Cash Flows
Year Ended Year Ended Year Ended
January 31, February 2, February 3,
(in millions) 2009 2008 2007
Cash flows from operating activities:
Net income $229.5 $ 201.3 $ 192.0
Adjustments to reconcile net income to net cash
provided by operating activities:
Depreciation and amortization 161.7 159.3 159.0
Provision for deferred income taxes 17.0 (46.8) (21.9)
Stock-based compensation expense 16.7 11.3 6.7
Other non-cash adjustments to net income 7.9 8.0 5.1
Changes in assets and liabilities increasing
(decreasing) cash and cash equivalents:
Merchandise inventories (34.6) (36.2) (6.2)
Other assets 27.3 (4.4) (19.8)
Accounts payable (7.5) 2.3 53.7
Income taxes payable (36.8) 46.9 1.6
Other current liabilities 6.1 8.7 31.8
Other liabilities 15.8 16.9 10.8
Net cash provided by operating activities 403.1 367.3 412.8
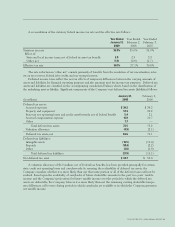
Cash flows from investing activities:
Capital expenditures (131.3) (189.0) (175.3)
Purchase of short-term investments (34.7) (1,119.2) (1,044.4)
Proceeds from sale of short-term investments 75.2 1,300.5 1,096.6
Purchase of restricted investments (29.0) (99.3) (84.5)
Proceeds from sale of restricted investments 18.2 90.9 75.2
Purchase of Deal$ assets, net of cash acquired of $0.3 —— (54.1)
Acquisition of favorable lease rights (0.4) (6.6) (4.2)
Net cash used in investing activities (102.0) (22.7) (190.7)
Cash flows from financing activities:
Principal payments under long-term debt and capital lease obligations (1.2) (0.6) (0.6)
Borrowings from revolving credit facility —362.4 —
Repayments of revolving credit facility —(362.4) —
Payments for share repurchases —(473.0) (248.2)
Proceeds from stock issued pursuant to stock-based compensation plans 21.6 71.6 40.3
Tax benefit of stock options exercised 2.3 13.0 5.6
Net cash provided by (used in) financing activities 22.7 (389.0) (202.9)
Net increase (decrease) in cash and cash equivalents 323.8 (44.4) 19.2
Cash and cash equivalents at beginning of year 40.6 85.0 65.8
Cash and cash equivalents at end of year $364.4 $ 40.6 $ 85.0
Supplemental disclosure of cash flow information:
Cash paid for:
Interest $9.7 $ 18.7 $ 14.9
Income taxes $140.4 $ 109.5 $ 125.5
Supplemental disclosure of non-cash investing and financing activities:
The Company purchased equipment under capital lease obligations amounting to $0.5 million and $0.1 million in the years ended
February 2, 2008 and February 3, 2007, respectively. Equipment purchased under capital lease obligations in the year ended
January 31, 2009 was less than $0.1 million.
See accompanying Notes to Consolidated Financial Statements.