Dollar General 2004 Annual Report Download - page 62
Download and view the complete annual report
Please find page 62 of the 2004 Dollar General annual report below. You can navigate through the pages in the report by either clicking on the pages listed below, or by using the keyword search tool below to find specific information within the annual report.-
 1
1 -
2
-
3
-
4
-
5
-
6
-
7
-
8
-
9
-
10
-
11
-
12
-
13
-
14
-
15
-
16
-
17
-
18
-
19
-
20
-
21
-
22
-
23
-
24
-
25
-
26
-
27
-
28
-
29
-
30
-
31
-
32
-
33
-
34
-
35
-
36
-
37
-
38
-
39
-
40
-
41
-
42
-
43
-
44
-
45
-
46
-
47
-
48
-
49
-
50
-
51
-
 52
52 -
 53
53 -
 54
54 -
 55
55 -
 56
56 -
 57
57 -
 58
58 -
 59
59 -
 60
60 -
 61
61 -
 62
62 -
 63
63 -
 64
64 -
 65
65 -
 66
66
 |
 |

60
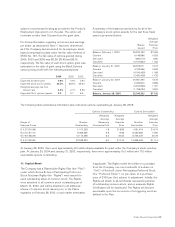
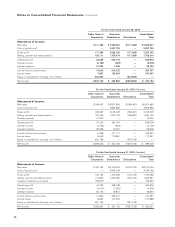
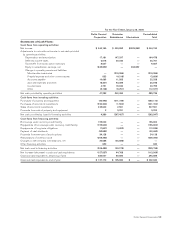
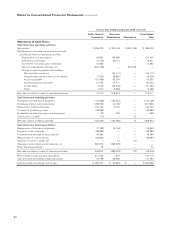
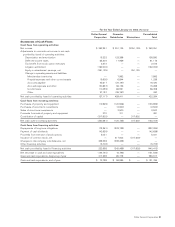
Notes to Consolidated Financial Statements (continued)
For the Year Ended January 30, 2004 (Restated)
Dollar General
Corporation
Guarantor
Subsidiaries Eliminations
Consolidated
Total
Statements of Cash Flows:
Cash flows from operating activities:
Net income $ 299,002 $ 300,156 $ (300,156) $ 299,002
Adjustments to reconcile net income to net cash
provided by (used in) operating activities:
Depreciation and amortization 19,961 134,496 — 154,457
Deferred income taxes (2,102) 20,713 — 18,611
Tax benefit from stock option exercises 14,565 — — 14,565
Equity in subsidiaries’ earnings, net (300,156) — 300,156 —
Change in operating assets and liabilities:
Merchandise inventories — (34,110) — (34,110)
Prepaid expenses and other current assets (7,323) (8,981) — (16,304)
Accounts payable (50,489) 83,754 — 33,265
Accrued expenses and other 15,752 44,771 — 60,523
Income taxes 4,079 (25,543) — (21,464)
Other 1,610 3,556 — 5,166
Net cash provided by (used in) operating activities (5,101) 518,812 — 513,711
Cash flows from investing activities:
Purchases of property and equipment (15,526) (124,613) — (140,139)
Purchases of short-term investments (199,950) (2,000) — (201,950)
Sales of short-term investments 132,725 2,000 — 134,725
Purchase of promissory notes (49,582) — — (49,582)
Proceeds from sale of property and equipment 39 230 — 269
Contribution of capital (10) — 10 —
Net cash used in investing activities (132,304) (124,383) 10 (256,677)
Cash flows from financing activities:
Repayments of long-term obligations (7,753) (8,154) — (15,907)
Payment of cash dividends (46,883) — — (46,883)
Proceeds from exercise of stock options 49,485 — — 49,485
Repurchases of common stock (29,687) — — (29,687)
Issuance of common stock, net — 10 (10) —
Changes in intercompany note balances, net 384,378 (384,378) — —
Other financing activities 73 — — 73
Net cash provided by (used in) financing activities 349,613 (392,522) (10) (42,919)
Net increase in cash and cash equivalents 212,208 1,907 — 214,115
Cash and cash equivalents, beginning of year 72,799 58,985 — 131,784
Cash and cash equivalents, end of year $ 285,007 $ 60,892 $ — $ 345,899