Dollar General 2004 Annual Report Download - page 37
Download and view the complete annual report
Please find page 37 of the 2004 Dollar General annual report below. You can navigate through the pages in the report by either clicking on the pages listed below, or by using the keyword search tool below to find specific information within the annual report.-
 1
1 -
2
-
3
-
4
-
5
-
6
-
7
-
8
-
9
-
10
-
11
-
12
-
13
-
14
-
15
-
16
-
17
-
18
-
19
-
20
-
21
-
22
-
23
-
24
-
25
-
26
-
 27
27 -
 28
28 -
 29
29 -
 30
30 -
 31
31 -
 32
32 -
 33
33 -
 34
34 -
 35
35 -
 36
36 -
 37
37 -
 38
38 -
 39
39 -
 40
40 -
 41
41 -
 42
42 -
 43
43 -
 44
44 -
 45
45 -
 46
46 -
 47
47 -
48
-
49
-
50
-
51
-
52
-
53
-
54
-
55
-
56
-
57
-
58
-
59
-
60
-
61
-
62
-
63
-
64
-
65
-
66
 |
 |

Dollar General Corporation 35
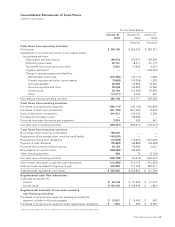
Consolidated Statements of Cash Flows
(Dollarsinthousands)
For the Years Ended
January 28,
2005
January 30,
2004
January 31,
2003
(Restated) (Restated)
Cash flows from operating activities:
Net income $ 344,190 $ 299,002 $ 262,351
Adjustments to reconcile net income to net cash provided
by operating activities:
Depreciation and amortization 164,478 154,457 138,590
Deferred income taxes 25,751 18,611 81,173
Tax benefit from stock option exercises 9,657 14,565 2,372
Litigation settlement —— (162,000)
Change in operating assets and liabilities:
Merchandise inventories (219,396) (34,110) 7,992
Prepaid expenses and other current assets (3,666) (16,304) 1,239
Accounts payable 22,258 33,265 18,420
Accrued expenses and other 35,048 60,523 15,269
Income taxes 23,793 (21,464) 56,458
Other (12,377) 5,166 430
Net cash provided by operating activities 389,736 513,711 422,294
Cash flows from investing activities:
Purchases of property and equipment (292,172) (140,139) (133,895)
Purchases of short-term investments (221,700) (201,950) (2,500)
Sales of short-term investments 247,501 134,725 2,500
Purchase of promissory notes —(49,582) —
Proceeds from sale of property and equipment 3,324 269 481
Net cash used in investing activities (263,047) (256,677) (133,414)
Cash flows from financing activities:
Borrowings under revolving credit facility 195,000 — —
Repayments of borrowings under revolving credit facility (195,000) — —
Repayments of long-term obligations (12,539) (15,907) (397,094)
Payment of cash dividends (52,682) (46,883) (42,638)
Proceeds from exercise of stock options 34,128 49,485 5,021
Repurchases of common stock (209,295) (29,687) —
Other financing activities 630 73 (5,702)
Net cash used in financing activities (239,758) (42,919) (440,413)
Net increase (decrease) in cash and cash equivalents (113,069) 214,115 (151,533)
Cash and cash equivalents, beginning of year 345,899 131,784 283,317
Cash and cash equivalents, end of year $ 232,830 $ 345,899 $ 131,784
Supplemental cash flow information:
Cash paid during year for:
Interest $ 26,748 $ 31,256 $ 41,015
Income taxes $ 133,100 $ 165,248 $ 1,834
Supplemental schedule of non-cash investing
and financing activities:
Purchases of property and equipment awaiting processing for
payment, included in Accounts payable $ 12,921 $ 9,643 $ 420
Purchases of property and equipment under capital lease obligations $ 1,844 $ 996 $ 8,453
The accompanying notes are an integral part of the consolidated financial statements.