Dollar General 2004 Annual Report Download - page 56
Download and view the complete annual report
Please find page 56 of the 2004 Dollar General annual report below. You can navigate through the pages in the report by either clicking on the pages listed below, or by using the keyword search tool below to find specific information within the annual report.-
 1
1 -
2
-
3
-
4
-
5
-
6
-
7
-
8
-
9
-
10
-
11
-
12
-
13
-
14
-
15
-
16
-
17
-
18
-
19
-
20
-
21
-
22
-
23
-
24
-
25
-
26
-
27
-
28
-
29
-
30
-
31
-
32
-
33
-
34
-
35
-
36
-
37
-
38
-
39
-
40
-
41
-
42
-
43
-
44
-
45
-
 46
46 -
 47
47 -
 48
48 -
 49
49 -
 50
50 -
 51
51 -
 52
52 -
 53
53 -
 54
54 -
 55
55 -
 56
56 -
 57
57 -
 58
58 -
 59
59 -
 60
60 -
 61
61 -
 62
62 -
 63
63 -
 64
64 -
 65
65 -
 66
66
 |
 |
54
Notes to Consolidated Financial Statements (continued)
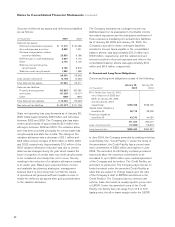
On November 30, 2004, the Board of Directors authorized
the Company to repurchase up to 10 million shares of its
outstanding common stock. Purchases may be made in
the open market or in privately negotiated transactions
from time to time subject to market conditions. The
objective of the share repurchase program was to
enhance shareholder value by purchasing shares at
a price that produces a return on investment that is
greater than the Company’s cost of capital. Additionally,
share repurchases generally will be undertaken only if
such purchases result in an accretive impact on the
Company’s fully diluted earnings per share calculation.
This authorization expires November 30, 2005. During
2004, the Company purchased approximately 0.5 million
shares pursuant to this authorization at a total cost of
$10.9 million.
On March 13, 2003, the Board of Directors authorized
the Company to repurchase up to 12 million shares of
its outstanding common stock in the open market or
in privately negotiated transactions from time to time
subject to market conditions. The objective of the share
repurchase program is consistent with the November
2004 repurchase program as described above. This
authorization expired March 13, 2005. During 2003,
approximately 1.5 million shares were repurchased at a
total cost of $29.7 million. During 2004, the Company
purchased approximately 10.5 million shares at a
total cost of $198.4 million. As of January 28, 2005,
approximately 12.0 million shares had been purchased,
substantially completing this share repurchase
authorization.
12. Related Party Transactions
In 2002, Cal Turner, the Company’s then Chairman and
Chief Executive Officer, made voluntary payments to the
Company totaling approximately $6.8 million in cash. Of
such amount, approximately $6.0 million represented the
value on April 10, 2002 of stock Mr. Turner acquired on
April 7, 1999 and April 20, 2000 upon the exercise of
stock options (net of the strike price of such options)
and approximately $0.8 million represented the value of
performance-based bonuses received by Mr. Turner in
April 1999 and April 2000. Mr. Turner voluntarily paid
such amounts to the Company because the options
vested and the performance bonuses were paid based
on performance measures that were attained under
the Company’s originally reported financial results for
the period covered by the 2001 Restatement. Those
measures would not have been attained under the
subsequently restated results. The Company recorded
the approximately $6.0 million receipt as a contribution of
capital, which was recorded as an increase in Additional
paid-in capital included in shareholders’ equity as of
January 31, 2003. The Company recorded the approxi-
mately $0.8 million receipt as a reduction of SG&A
expenses during the third quarter of 2002.
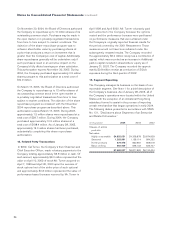
13. Segment Reporting
The Company manages its business on the basis of one
reportable segment. See Note 1 for a brief description of
the Company’s business. As of January 28, 2005, all of
the Company’s operations were located within the United
States with the exception of an immaterial Hong Kong
subsidiary formed to assist in the process of importing
certain merchandise that began operations in early 2004.
The following data is presented in accordance with SFAS
No. 131, “Disclosures about Segments of an Enterprise
and Related Information.”
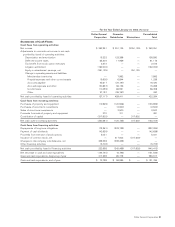
(In thousands) 2004 2003 2002
Classes of similar
products:
Net sales:
Highly consumable $4,825,051 $4,206,878 $3,674,929
Seasonal 1,263,991 1,156,114 994,250
Home products 879,476 860,867 808,518
Basic clothing 692,409 648,133 622,707
$7,660,927 $6,871,992 $6,100,404