Dollar General 2004 Annual Report Download - page 17
Download and view the complete annual report
Please find page 17 of the 2004 Dollar General annual report below. You can navigate through the pages in the report by either clicking on the pages listed below, or by using the keyword search tool below to find specific information within the annual report.-
 1
1 -
2
-
3
-
4
-
5
-
6
-
 7
7 -
 8
8 -
 9
9 -
 10
10 -
 11
11 -
 12
12 -
 13
13 -
 14
14 -
 15
15 -
 16
16 -
 17
17 -
 18
18 -
 19
19 -
 20
20 -
 21
21 -
 22
22 -
 23
23 -
 24
24 -
 25
25 -
 26
26 -
 27
27 -
28
-
29
-
30
-
31
-
32
-
33
-
34
-
35
-
36
-
37
-
38
-
39
-
40
-
41
-
42
-
43
-
44
-
45
-
46
-
47
-
48
-
49
-
50
-
51
-
52
-
53
-
54
-
55
-
56
-
57
-
58
-
59
-
60
-
61
-
62
-
63
-
64
-
65
-
66
 |
 |

Dollar General Corporation 15
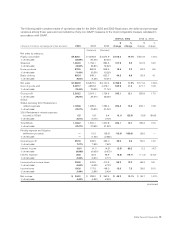
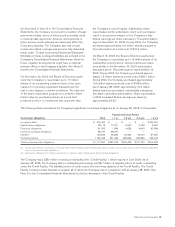
The following table contains results of operations data for the 2004, 2003 and 2002 fiscal years, the dollar and percentage
variances among those years and reconciliations of any non-GAAP measures to the most comparable measure calculated in
accordance with GAAP.
2004 vs. 2003 2003 vs. 2002
(Amounts in millions, excluding per share amounts) 2004 2003 2002
$
change
%
change
$
change
%
change
(Restated) (Restated)
Net sales by category:
Highly consumable $ 4,825.1 $ 4,206.9 $ 3,674.9 $ 618.2 14.7% $ 531.9 14.5%
%ofnetsales 62.98% 61.22% 60.24%
Seasonal 1,264.0 1,156.1 994.3 107.9 9.3 161.9 16.3
%ofnetsales 16.50% 16.82% 16.30%
Home products 879.5 860.9 808.5 18.6 2.2 52.3 6.5
%ofnetsales 11.48% 12.53% 13.25%
Basic clothing 692.4 648.1 622.7 44.3 6.8 25.4 4.1
%ofnetsales 9.04% 9.43% 10.21%
Net sales $ 7,660.9 $ 6,872.0 $ 6,100.4 $ 788.9 11.5% $ 771.6 12.6%
Cost of goods sold 5,397.7 4,853.9 4,376.1 543.9 11.2 477.7 10.9
%ofnetsales 70.46% 70.63% 71.74%
Gross profit 2,263.2 2,018.1 1,724.3 245.1 12.1 293.9 17.0
%ofnetsales 29.54% 29.37% 28.26%
SG&A:
SG&A excluding 2001 Restatement-
related expenses 1,705.8 1,499.5 1,294.4 206.3 13.8 205.1 15.8
%ofnetsales 22.27% 21.82% 21.22%
2001 Restatement-related expenses
included in SG&A 0.5 0.6 6.4 (0.1) (23.5) (5.8) (90.8)
%ofnetsales 0.01% 0.01% 0.10%
Total SG&A 1,706.2 1,500.1 1,300.8 206.1 13.7 199.3 15.3
%ofnetsales 22.27% 21.83% 21.32%
Penalty expense and litigation
settlement proceeds —10.0 (29.5) (10.0) (100.0) 39.5 —
%ofnetsales — 0.15% (0.48)%
Operating profit 557.0 508.0 453.0 49.0 9.6 55.0 12.2
%ofnetsales 7.27% 7.39% 7.43%
Interest income (6.6) (4.1) (4.3) (2.5) 60.2 0.2 (4.7)
%ofnetsales (0.09)% (0.06)% (0.07)%
Interest expense 28.8 35.6 46.9 (6.8) (19.1) (11.3) (24.2)
%ofnetsales 0.38% 0.52% 0.77%
Income before income taxes 534.8 476.5 410.3 58.2 12.2 66.2 16.1
%ofnetsales 6.98% 6.93% 6.73%
Income taxes 190.6 177.5 148.0 13.0 7.3 29.5 20.0
%ofnetsales 2.49% 2.58% 2.43%
Net income $ 344.2 $ 299.0 $ 262.4 $ 45.2 15.1% $ 36.7 14.0%
%ofnetsales 4.49% 4.35% 4.30%
(continued)