Dollar General 2004 Annual Report Download - page 3
Download and view the complete annual report
Please find page 3 of the 2004 Dollar General annual report below. You can navigate through the pages in the report by either clicking on the pages listed below, or by using the keyword search tool below to find specific information within the annual report.-
 1
1 -
 2
2 -
 3
3 -
 4
4 -
 5
5 -
 6
6 -
 7
7 -
 8
8 -
 9
9 -
 10
10 -
 11
11 -
 12
12 -
 13
13 -
 14
14 -
15
-
16
-
17
-
18
-
19
-
20
-
21
-
22
-
23
-
24
-
25
-
26
-
27
-
28
-
29
-
30
-
31
-
32
-
33
-
34
-
35
-
36
-
37
-
38
-
39
-
40
-
41
-
42
-
43
-
44
-
45
-
46
-
47
-
48
-
49
-
50
-
51
-
52
-
53
-
54
-
55
-
56
-
57
-
58
-
59
-
60
-
61
-
62
-
63
-
64
-
65
-
66
 |
 |

Dollar General Corporation 1
Financial Highlights
January 28, January 30, January 31, February 1, February 2,
(Dollars in thousands except per share data) 2005 2004 (b) 2003 (b) 2002 (b) 2001 (b) (c)
Net sales $ 7,660,927 $ 6,871,992 $ 6,100,404 $ 5,322,895 $ 4,550,571
Net income $ 344,190 $ 299,002 $ 262,351 $ 203,874 $ 66,955
Diluted earnings per share (a) $ 1.04 $ 0.89 $ 0.78 $ 0.61 $ 0.20
Basic earnings per share (a) $ 1.04 $ 0.89 $ 0.79 $ 0.61 $ 0.20
Cash dividends per share of
common stock (a) $ 0.16 $ 0.14 $ 0.13 $ 0.13 $ 0.12
Total assets $ 2,841,004 $ 2,621,117 $ 2,303,619 $ 2,526,481 $ 2,271,217
Long-term obligations $ 258,462 $ 265,337 $ 330,337 $ 339,470 $ 720,764
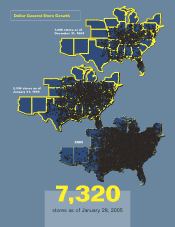
Total number of stores 7,320 6,700 6,113 5,540 5,000
Same-store sales increase 3.2% 4.0% 5.7% 7.3% 0.9%
Non-GAAP Disclosures
The Letter to Shareholders and the graph on page 6 include earnings per share (“EPS”), excluding items relating to the restatement
of the Company’s 1998 through 2000 financial results (the “2001 Restatement”), a measure not derived in accordance with generally
accepted accounting principles (“GAAP”). The table below shows the reconciliation of this measure to EPS computed in accordance
with GAAP. Management believes that this information indicates more clearly the Company’s comparative year-to-year operating
results. This information should not be considered a substitute for EPS derived in accordance with GAAP.
January 28, January 30, January 31, February 1, February 2,
(Dollars in thousands except per share data) 2005 2004 (b) 2003 (b) 2002 (b) 2001 (b) (c)
Net income, in accordance with GAAP $344,190 $299,002 $262,351 $203,874 $ 66,955
2001 Restatement-related items:
Penalty expense and litigation
settlement expense (proceeds) —10,000 (29,541) — 162,000
2001 Restatement-related expenses
included in SG&A 452 591 6,395 28,422 —
Tax effect (177) (232) 9,073 (10,431) (63,000)
Net income, excluding 2001
Restatement-related items $344,465 $309,361 $248,278 $221,865 $165,955
Weighted average diluted shares (a) 332,068 337,636 335,050 335,017 333,858
Diluted earnings per share, excluding
2001 Restatement-related items (a) $ 1.04 $ 0.92 $ 0.74 $ 0.66 $ 0.50
(a) As adjusted to give retroactive effect to all common stock splits.
(b) The Company restated its financial statements for fiscal years 2000 through 2003 as discussed in Note 2 to the Consolidated Financial Statements for
the year ended January 28, 2005, included in this Annual Report. For fiscal years 2001 and 2000, this restatement reduced previously reported net
income by approximately $3.6 million and $3.7 million, respectively, or approximately $.01 per diluted share in each year.
(c) 53-week year.