Dish Network 2009 Annual Report Download - page 71
Download and view the complete annual report
Please find page 71 of the 2009 Dish Network annual report below. You can navigate through the pages in the report by either clicking on the pages listed below, or by using the keyword search tool below to find specific information within the annual report.-
 1
1 -
2
-
3
-
4
-
5
-
6
-
7
-
8
-
9
-
10
-
11
-
12
-
13
-
14
-
15
-
16
-
17
-
18
-
19
-
20
-
21
-
22
-
23
-
24
-
25
-
26
-
27
-
28
-
29
-
30
-
31
-
32
-
33
-
34
-
35
-
36
-
37
-
38
-
39
-
40
-
41
-
42
-
43
-
44
-
45
-
46
-
47
-
48
-
49
-
50
-
51
-
52
-
53
-
54
-
55
-
56
-
57
-
58
-
59
-
60
-
 61
61 -
 62
62 -
 63
63 -
 64
64 -
 65
65 -
 66
66 -
 67
67 -
 68
68 -
 69
69 -
 70
70 -
 71
71 -
 72
72 -
 73
73 -
 74
74 -
 75
75 -
 76
76 -
 77
77 -
 78
78 -
 79
79 -
 80
80 -
 81
81 -
82
-
83
-
84
-
85
-
86
-
87
-
88
-
89
-
90
-
91
-
92
-
93
-
94
-
95
-
96
-
97
-
98
-
99
-
100
-
101
-
102
-
103
-
104
-
105
-
106
-
107
-
108
-
109
-
110
-
111
-
112
-
113
-
114
-
115
-
116
-
117
-
118
-
119
-
120
-
121
-
122
-
123
-
124
-
125
-
126
-
127
-
128
-
129
-
130
-
131
-
132
-
133
-
134
-
135
-
136
-
137
-
138
-
139
-
140
-
141
-
142
-
143
-
144
-
145
-
146
-
147
-
148
-
149
-
150
-
151
-
152
 |
 |

Item 7. MANAGEMENT’S DISCUSSION AND ANALYSIS OF FINANCIAL CONDITION AND
RESULTS OF OPERATIONS - Continued
61
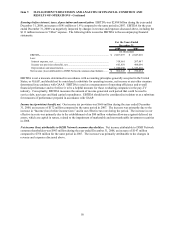
The decrease in net cash outflows from investing activities from 2007 to 2008 of $873 million primarily resulted from a
net decrease in purchases of marketable investment securities, a decrease in cash used for purchases of property and
equipment, a decrease in cash used for the purchases of strategic investments, including Sling Media, and an increase in
proceeds from the sale of investments. The overall net decreases were partially offset by an increase in cash used for
purchases of FCC licenses during 2008 compared to 2007.
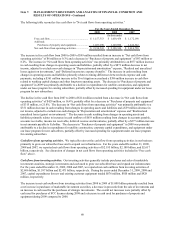
Cash flows from financing activities. Our financing activities generally include net proceeds related to the issuance of
long-term debt, cash used for the repurchase, redemption or payment of long-term-debt and capital lease obligations,
dividends paid on our Class A and Class B common stock and repurchases of our Class A common stock. For the year
ended December 31, 2009, we reported net cash inflows from financing activities of $418 million. For the years ended
December 31, 2008 and 2007, we reported net cash outflows from financing activities of $1.412 billion and $976
million, respectively.
The increase in net cash inflows from 2008 to 2009 primarily resulted from a decrease in the repayment of long-term
debt and capital lease obligations, an increase in the net proceeds related to the issuance of long-term debt and a decline
in stock repurchases. This increase in net cash inflows was partially offset by the dividend payment of $894 million
during 2009. In addition, the 2008 cash outflows were negatively impacted by the distribution to EchoStar related to
the Spin-off.
The increase in net cash outflows from 2007 to 2008 includes an increase in cash outflows for debt redemptions,
distributions related to the Spin-off and stock repurchases. This increase in net cash outflows was partially offset by an
increase in cash inflows related to issuance of new debt during 2008.
Other Liquidity Items
700 MHz Spectrum
In 2008, we paid $712 million to acquire certain 700 MHz wireless licenses, which were granted to us by the FCC in
February 2009. To commercialize these licenses and satisfy FCC build-out requirements, we will be required to
make significant additional investments or partner with others. Depending on the nature and scope of such
commercialization and build-out, any such investment or partnership could vary significantly. Part or all of our
licenses may be terminated for failure to satisfy FCC build-out requirements. We are currently performing a market
test to evaluate different technologies and consumer acceptance.
Subscriber Churn
DISH Network added approximately 422,000 net new subscribers for the year ended December 31, 2009, compared
to losing approximately 102,000 net subscribers during the same period in 2008. This increase primarily resulted
from an increase in gross new subscribers and a decrease in our subscriber churn rate to 1.64% compared to 1.86%
for the same period in 2008. See “Results of Operations” above for further discussion.
Our distribution relationship with AT&T was a substantial contributor to our gross and net subscriber additions in
prior years, accounting for approximately 17% of our gross subscriber additions for the year ended December 31,
2008. This distribution relationship ended January 31, 2009. Consequently, beginning with the second quarter
2009, AT&T no longer contributed to our gross subscriber additions. In addition, nearly one million of our current
subscribers were acquired through our distribution relationship with AT&T and subscribers acquired through this
channel have historically churned at a higher rate than our overall subscriber base. Although AT&T is not permitted
to target these subscribers for transition to another pay-TV service and we and AT&T are required to maintain
bundled billing and cooperative customer service for these subscribers, these subscribers may continue to churn at
higher than historical rates following termination of the AT&T distribution relationship.