Dish Network 2009 Annual Report Download - page 126
Download and view the complete annual report
Please find page 126 of the 2009 Dish Network annual report below. You can navigate through the pages in the report by either clicking on the pages listed below, or by using the keyword search tool below to find specific information within the annual report.-
 1
1 -
2
-
3
-
4
-
5
-
6
-
7
-
8
-
9
-
10
-
11
-
12
-
13
-
14
-
15
-
16
-
17
-
18
-
19
-
20
-
21
-
22
-
23
-
24
-
25
-
26
-
27
-
28
-
29
-
30
-
31
-
32
-
33
-
34
-
35
-
36
-
37
-
38
-
39
-
40
-
41
-
42
-
43
-
44
-
45
-
46
-
47
-
48
-
49
-
50
-
51
-
52
-
53
-
54
-
55
-
56
-
57
-
58
-
59
-
60
-
61
-
62
-
63
-
64
-
65
-
66
-
67
-
68
-
69
-
70
-
71
-
72
-
73
-
74
-
75
-
76
-
77
-
78
-
79
-
80
-
81
-
82
-
83
-
84
-
85
-
86
-
87
-
88
-
89
-
90
-
91
-
92
-
93
-
94
-
95
-
96
-
97
-
98
-
99
-
100
-
101
-
102
-
103
-
104
-
105
-
106
-
107
-
108
-
109
-
110
-
111
-
112
-
113
-
114
-
115
-
 116
116 -
 117
117 -
 118
118 -
 119
119 -
 120
120 -
 121
121 -
 122
122 -
 123
123 -
 124
124 -
 125
125 -
 126
126 -
 127
127 -
 128
128 -
 129
129 -
 130
130 -
 131
131 -
 132
132 -
 133
133 -
 134
134 -
 135
135 -
 136
136 -
137
-
138
-
139
-
140
-
141
-
142
-
143
-
144
-
145
-
146
-
147
-
148
-
149
-
150
-
151
-
152
 |
 |

DISH NETWORK CORPORATION
NOTES TO CONSOLIDATED FINANCIAL STATEMENTS - Continued
F-36
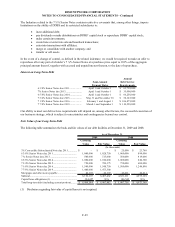
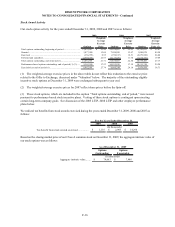
Stock Award Activity
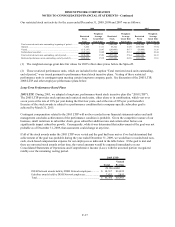
Our stock option activity for the years ended December 31, 2009, 2008 and 2007 was as follows:
Options
Weighted-
Average
Exercise
Price Options
Weighted-
Average
Exercise
Price Options
Weighted-
Average
Exercise
Price (2)
Total options outstanding, beginning of period.............................. 21,835,687 22.50$ 20,938,403 22.61$ 22,741,833 25.67$
Granted .......................................................................................... 3,077,000 15.69 7,998,500 13.67 1,890,870 40.50
Exercised ....................................................................................... (356,793) 8.95 (976,187) 19.51 (2,079,909) 24.88
Forfeited and cancelled.................................................................. (2,694,203) 22.93 (6,125,029) 11.70 (1,614,391) 19.69
Total options outstanding, end of period (1).................................. 21,861,691 21.71 21,835,687 22.50 20,938,403 27.17
Performance based options outstanding, end of period (1) (3)....... 9,362,500 17.23 10,253,250 17.19 10,111,750 20.28
Exercisable at end of period (1)..................................................... 8,062,091 27.74 6,606,244 29.16 5,976,459 34.73
2009 2008 2007
(1) The weighted-average exercise prices in the above table do not reflect this reduction to the exercise price
related to the Offer to Exchange, discussed under “Valuation” below. The majority of the outstanding eligible
incentive stock options at December 31, 2009 were exchanged subsequent to year end.
(2) The weighted-average exercise prices for 2007 reflect share prices before the Spin-off.
(3) These stock options, which are included in the caption “Total options outstanding, end of period,” were issued
pursuant to performance-based stock incentive plans. Vesting of these stock options is contingent upon meeting
certain long-term company goals. See discussion of the 2005 LTIP, 2008 LTIP and other employee performance
plans below.
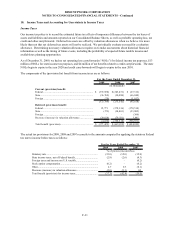
We realized tax benefits from stock awards exercised during the years ended December 31, 2009, 2008 and 2007 as
follows:
2009 2008 2007
Tax benefit from s tock awards exercised................. $ 1,116 $ 2,905 $ 14,294
(In thousands)
For the Years Ended December 31,
Based on the closing market price of our Class A common stock on December 31, 2009, the aggregate intrinsic value of
our stock options was as follows:
Options
Outstanding
Options
Exercisable
Aggregate intrinsic value........ 74,663$ 7,486$
As of December 31, 2009
(In thousands)