Dish Network 2009 Annual Report Download - page 58
Download and view the complete annual report
Please find page 58 of the 2009 Dish Network annual report below. You can navigate through the pages in the report by either clicking on the pages listed below, or by using the keyword search tool below to find specific information within the annual report.-
 1
1 -
2
-
3
-
4
-
5
-
6
-
7
-
8
-
9
-
10
-
11
-
12
-
13
-
14
-
15
-
16
-
17
-
18
-
19
-
20
-
21
-
22
-
23
-
24
-
25
-
26
-
27
-
28
-
29
-
30
-
31
-
32
-
33
-
34
-
35
-
36
-
37
-
38
-
39
-
40
-
41
-
42
-
43
-
44
-
45
-
46
-
47
-
 48
48 -
 49
49 -
 50
50 -
 51
51 -
 52
52 -
 53
53 -
 54
54 -
 55
55 -
 56
56 -
 57
57 -
 58
58 -
 59
59 -
 60
60 -
 61
61 -
 62
62 -
 63
63 -
 64
64 -
 65
65 -
 66
66 -
 67
67 -
 68
68 -
69
-
70
-
71
-
72
-
73
-
74
-
75
-
76
-
77
-
78
-
79
-
80
-
81
-
82
-
83
-
84
-
85
-
86
-
87
-
88
-
89
-
90
-
91
-
92
-
93
-
94
-
95
-
96
-
97
-
98
-
99
-
100
-
101
-
102
-
103
-
104
-
105
-
106
-
107
-
108
-
109
-
110
-
111
-
112
-
113
-
114
-
115
-
116
-
117
-
118
-
119
-
120
-
121
-
122
-
123
-
124
-
125
-
126
-
127
-
128
-
129
-
130
-
131
-
132
-
133
-
134
-
135
-
136
-
137
-
138
-
139
-
140
-
141
-
142
-
143
-
144
-
145
-
146
-
147
-
148
-
149
-
150
-
151
-
152
 |
 |

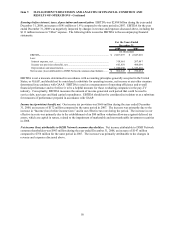
Item 7. MANAGEMENT’S DISCUSSION AND ANALYSIS OF FINANCIAL CONDITION AND
RESULTS OF OPERATIONS - Continued
48
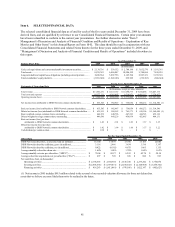
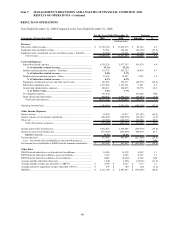
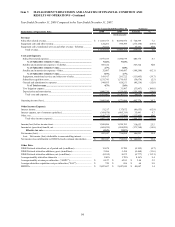
RESULTS OF OPERATIONS
Year Ended December 31, 2009 Compared to the Year Ended December 31, 2008.
For the Years Ended December 31, Variance
Statements of Operations Data 2009 2008 Amount %
(In thousands)
Revenue:
Subscriber-related revenue............................................................................. 11,538,729$ 11,455,575$ 83,154$ 0.7
Equipment sales and other revenue................................................................ 97,863 124,261 (26,398) (21.2)
Equipment sales, transitional services and other revenue - EchoStar............. 27,559 37,351 (9,792) (26.2)
Total revenue.......................................................................................... 11,664,151 11,617,187 46,964 0.4
Costs and Expenses:
Subscriber-related expenses........................................................................ 6,359,329 5,977,355 381,974 6.4
% of Subscriber-related revenue...................................................... 55.1% 52.2%
Satellite and transmission expenses - EchoStar........................................... 319,752 305,322 14,430 4.7
% of Subscriber-related revenue...................................................... 2.8% 2.7%
Satellite and transmission expenses - Other................................................ 33,672 32,407 1,265 3.9
% of Subscriber-related revenue...................................................... 0.3% 0.3%
Equipment, transitional services and other cost of sales............................. 121,238 169,917 (48,679) (28.6)
Subscriber acquisition costs........................................................................ 1,539,562 1,531,741 7,821 0.5
General and administrative expenses.......................................................... 602,611 544,035 58,576 10.8
% of Total revenue............................................................................ 5.2% 4.7%
Tivo litigation expense................................................................................ 361,024 - 361,024 NM
Depreciation and amortization.................................................................... 940,033 1,000,230 (60,197) (6.0)
Total costs and expenses......................................................................... 10,277,221 9,561,007 716,214 7.5
Operating income (loss)................................................................................. 1,386,930 2,056,180 (669,250) (32.5)
Other Income (Expense):
Interest income............................................................................................... 30,034
51,217 (21,183) (41.4)
Interest expense, net of amounts capitalized.................................................. (388,425)
(369,878) (18,547) (5.0)
Other, net....................................................................................................... (15,707) (168,713) 153,006 90.7
Total other income (expense).................................................................. (374,098) (487,374) 113,276 23.2
Income (loss) before income taxes................................................................. 1,012,832
1,568,806 (555,974) (35.4)
Income tax (provision) benefit, net................................................................ (377,429) (665,859) 288,430 43.3
Effective tax rate .................................................................................. 37.3% 42.4%
Net income (loss)........................................................................................... 635,403 902,947 (267,544) (29.6)
Less: Net income (loss) attributable to noncontrolling interest................. (142) - (142) NM
Net income (loss) attributable to DISH Network common shareholders....... 635,545$ 902,947$ (267,402)$ (29.6)
Other Data:
DISH Network subscribers, as of period end (in millions)............................ 14.100 13.678 0.422 3.1
DISH Network subscriber additions, gross (in millions)................................ 3.118 2.966 0.152 5.1
DISH Network subscriber additions, net (in millions)................................... 0.422 (0.102) 0.524 NM
Average monthly subscriber churn rate.......................................................... 1.64% 1.86% (0.22%) (11.8)
Average monthly revenue per subscriber ("ARPU")..................................... 70.04$ 69.27$ 0.77$ 1.1
Average subscriber acquisition cost per subscriber ("SAC")......................... 697$ 720$ (23)$ (3.2)
EBITDA......................................................................................................... 2,311,398$ 2,887,697$ (576,299)$ (20.0)