Dish Network 2009 Annual Report Download - page 65
Download and view the complete annual report
Please find page 65 of the 2009 Dish Network annual report below. You can navigate through the pages in the report by either clicking on the pages listed below, or by using the keyword search tool below to find specific information within the annual report.-
 1
1 -
2
-
3
-
4
-
5
-
6
-
7
-
8
-
9
-
10
-
11
-
12
-
13
-
14
-
15
-
16
-
17
-
18
-
19
-
20
-
21
-
22
-
23
-
24
-
25
-
26
-
27
-
28
-
29
-
30
-
31
-
32
-
33
-
34
-
35
-
36
-
37
-
38
-
39
-
40
-
41
-
42
-
43
-
44
-
45
-
46
-
47
-
48
-
49
-
50
-
51
-
52
-
53
-
54
-
 55
55 -
 56
56 -
 57
57 -
 58
58 -
 59
59 -
 60
60 -
 61
61 -
 62
62 -
 63
63 -
 64
64 -
 65
65 -
 66
66 -
 67
67 -
 68
68 -
 69
69 -
 70
70 -
 71
71 -
 72
72 -
 73
73 -
 74
74 -
 75
75 -
76
-
77
-
78
-
79
-
80
-
81
-
82
-
83
-
84
-
85
-
86
-
87
-
88
-
89
-
90
-
91
-
92
-
93
-
94
-
95
-
96
-
97
-
98
-
99
-
100
-
101
-
102
-
103
-
104
-
105
-
106
-
107
-
108
-
109
-
110
-
111
-
112
-
113
-
114
-
115
-
116
-
117
-
118
-
119
-
120
-
121
-
122
-
123
-
124
-
125
-
126
-
127
-
128
-
129
-
130
-
131
-
132
-
133
-
134
-
135
-
136
-
137
-
138
-
139
-
140
-
141
-
142
-
143
-
144
-
145
-
146
-
147
-
148
-
149
-
150
-
151
-
152
 |
 |
Item 7. MANAGEMENT’S DISCUSSION AND ANALYSIS OF FINANCIAL CONDITION AND
RESULTS OF OPERATIONS - Continued
55
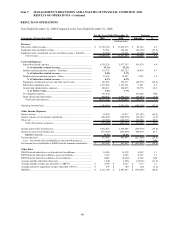
DISH Network subscribers. As of December 31, 2008, we had approximately 13.678 million DISH Network
subscribers compared to approximately 13.780 million subscribers at December 31, 2007, a decrease of 102,000 or
0.7%. DISH Network added approximately 2.966 million gross new subscribers for the year ended December 31,
2008, compared to approximately 3.434 million gross new subscribers during 2007, a decrease of approximately
468,000 gross new subscribers.
DISH Network lost approximately 102,000 net subscribers for the year ended December 31, 2008, compared to
adding approximately 675,000 net new subscribers during the same period in 2007. This decrease primarily resulted
from lower gross new subscribers discussed above, an increase in our subscriber churn rate, and churn on a larger
average subscriber base for the year. Our average monthly subscriber churn for the year ended December 31, 2008
was 1.86%, compared to 1.70% for the same period in 2007.
We believe our gross and net subscriber additions as well as our subscriber churn were negatively impacted by weak
economic conditions, aggressive promotional and retention offerings by our competition, our relative discipline in
our own promotional and retention activities including the amount of discounted programming or equipment we
have offered, the heavy marketing of HD service by our competition, the growth of fiber-based and Internet-based
pay TV providers, signal theft and other forms of fraud, and operational inefficiencies at DISH Network. Most of
these factors have affected both gross new subscriber additions as well as existing subscriber churn.
Subscriber-related revenue. DISH Network “Subscriber-related revenue” totaled $11.456 billion for the year ended
December 31, 2008, an increase of $765 million or 7.2% compared to 2007. This increase was primarily related to
the increase in “ARPU” discussed below and a higher average subscriber base in 2008 compared to 2007.
ARPU. Average monthly revenue per subscriber was $69.27 during the year ended December 31, 2008 versus $65.83
during the same period in 2007. The $3.44 or 5.2% increase in ARPU was primarily attributable to (i) price increases
in February 2008 and 2007 on some of our most popular programming packages, (ii) an increase in hardware related
fees, including rental fees and fees for DVRs, (iii) increased penetration of HD programming driven in part by the
availability of HD local channels, (iv) an increase in fees earned from our in-home service operations, and (v)
increased advertising revenue. This increase was partially offset by a decrease in revenue from our original
agreement with AT&T.
Equipment sales and other revenue. “Equipment sales and other revenue” totaled $124 million during the year ended
December 31, 2008, a decrease of $275 million or 68.9% compared to the same period during 2007. The decrease in
“Equipment sales and other revenue” primarily resulted from the distribution of our set-top box business and certain
other revenue-generating assets to EchoStar in connection with the Spin-off, partially offset by increases in other
revenue. During the year ended December 31, 2007, our set-top box business that was distributed to EchoStar
accounted for $282 million of our “Equipment sales and other revenue.”
Equipment sales, transitional services and other revenue – EchoStar. “Equipment sales, transitional services and
other revenue – EchoStar” totaled $37 million during the year ended December 31, 2008 as a result of the Spin-off.
Subscriber-related expenses. “Subscriber-related expenses” totaled $5.977 billion during the year ended December
31, 2008, an increase of $481 million or 8.7% compared to the same period in 2007. The increase in “Subscriber-
related expenses” was primarily attributable to higher costs for: (i) programming content, (ii) customer retention, (iii)
call center operations, (iv) in-home service operations, (v) the refurbishment and repair of receiver systems used in
our equipment lease programs, partially offset by a decrease in costs associated with our original agreement with
AT&T. The increase in customer retention expense was primarily driven by more upgrading of existing customers
to HD and DVR receivers and the changing of equipment for certain subscribers to make more efficient use of
satellite bandwidth in support of HD and other initiatives. We believe that the benefit from the increase in available
satellite bandwidth outweighs the short-term cost of these equipment changes. The increases related to call center
and in-home service operations were driven in part by our investments in staffing, training, information systems, and
other initiatives. These investments are intended to help combat inefficiencies introduced by the increasing
complexity of our business and technology, improve customer satisfaction, reduce churn, increase productivity, and
allow us to better scale our business over the long run. We cannot, however, be certain that our increased spending
will ultimately yield these benefits. In the meantime, we may continue to incur higher costs as a result of both our
operational inefficiencies and increased spending. “Subscriber-related expenses” represented 52.2% and 51.4% of