Dish Network 2002 Annual Report Download - page 36
Download and view the complete annual report
Please find page 36 of the 2002 Dish Network annual report below. You can navigate through the pages in the report by either clicking on the pages listed below, or by using the keyword search tool below to find specific information within the annual report.-
 1
1 -
2
-
3
-
4
-
5
-
6
-
7
-
8
-
9
-
10
-
11
-
12
-
13
-
14
-
15
-
16
-
17
-
18
-
19
-
20
-
21
-
22
-
23
-
24
-
25
-
 26
26 -
 27
27 -
 28
28 -
 29
29 -
 30
30 -
 31
31 -
 32
32 -
 33
33 -
 34
34 -
 35
35 -
 36
36 -
 37
37 -
 38
38 -
 39
39 -
 40
40 -
 41
41 -
 42
42 -
 43
43 -
 44
44 -
 45
45 -
 46
46 -
47
-
48
-
49
-
50
-
51
-
52
-
53
-
54
-
55
-
56
-
57
-
58
-
59
-
60
-
61
-
62
-
63
-
64
-
65
-
66
-
67
-
68
-
69
-
70
-
71
-
72
-
73
-
74
-
75
-
76
-
77
-
78
-
79
-
80
-
81
-
82
-
83
-
84
-
85
-
86
-
87
-
88
-
89
-
90
-
91
-
92
-
93
-
94
-
95
-
96
-
97
-
98
-
99
-
100
-
101
-
102
-
103
 |
 |
34
It is important to note that EBITDA and pre-marketing cash flow are supplemental non-GAAP measures and
do not represent cash provided or used by operating activities. Through 2002, we used EBITDA and pre-marketing
cash flow as two of the measurements of operating efficiency and overall financial performance and believed these
can be helpful measures for those evaluating companies in the multi-channel video programming distribution
industry. Conceptually, EBITDA measures the amount of income generated each period that could be used to
service debt, pay taxes and fund capital expenditures because EBITDA is independent of the actual leverage and
capital expenditures employed by the business. Pre-marketing cash flow measures EBITDA before costs incurred to
acquire subscribers to help assess the amount of income generated each period to be used to service debt and acquire
subscribers. EBITDA and pre-marketing cash flow should not be considered in isolation or as a substitute for
measures of performance prepared in accordance with generally accepted accounting principles.
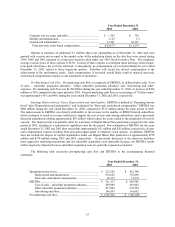
Depreciation and Amortization. “Depreciation and amortization” expense totaled $373 million during the
year ended December 31, 2002, a $94 million increase compared to the same period in 2001. The increase in
“Depreciation and amortization” expense principally resulted from an increase in depreciation related to the
commencement of commercial operation of EchoStar VII in April 2002, commencement of commercial operations of
EchoStar VIII in October 2002 and Digital Home Plan equipment and other additional depreciable assets placed in
service. This increase was partially offset by a reduction of approximately $19 million of amortization expense as a
result of our adoption of Statement of Financial Accounting Standards No. 142 (“FAS 142”). In accordance with
FAS 142, effective January 2002 we ceased amortization of our FCC authorizations.
Other Income and Expense. “Other expense,” net, totaled $1.230 billion during the year ended December
31, 2002, an increase of $804 million compared to the same period in 2001. This increase is primarily attributable to
costs expensed upon termination of the merger of approximately $690 million, which consist of a $600 million
termination fee paid to Hughes, $57 million of previously capitalized merger costs and $33 million of fees paid in
connection with merger financing activities. The increase also resulted from an increase in “Other” related to net losses
on marketable and non-marketable investment securities of approximately $136 million recorded in 2002 compared to
approximately $110 million recorded in 2001 and net charges of approximately $20 million relating to the Vivendi
contingent value rights which were outstanding during a portion of 2002. The contingent value rights are described
more fully in Note 1 to the accompanying financial statements. The increase in “Other expense” was partially offset by
a decrease in equity losses of affiliates. “Interest expense, net of amounts capitalized” increased as a result of the
issuance of our 9 1/8% Senior Notes in December 2001, the issuance of our 5 3/4% Convertible Subordinated Notes in
May 2001 and interest costs related to our merger financing activities. “Interest income” increased as a result of higher
cash balances in 2002 as compared to 2001.
Net loss. “Net loss” was $882 million during the year ended December 31, 2002, an increase of $667 million
compared to “Net loss” of $215 million for the same period in 2001. The increase was primarily attributable to an
increase in “Other income (expense)” discussed above. The increase in net loss was partially offset by an improvement
in “Operating income (loss)” as discussed above.
Net loss attributable to common shareholders. “Net loss attributable to common shareholders” was $444
million during the year ended December 31, 2002, an increase of $228 million compared to “Net loss attributable to
common shareholders” of $216 million for the same period in 2001. The increase is primarily attributable to the
increase in “Net loss”, discussed above. The increase was partially offset by a $437 million gain on the redemption of
Series D convertible preferred stock from Vivendi. The redemption is described more fully in Note 1 to the
accompanying financial statements.
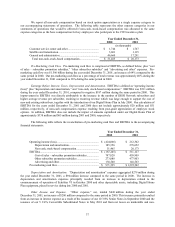
Net cash flows from operating activities and purchases of property and equipment. “Net cash flows from
operating activities,” as reported in our consolidated statements of cash flows, includes net income or loss for the
period, adjusted for certain non-cash items including, but not limited to, depreciation and amortization, realized and
unrealized gains and losses on investments, deferred tax expense, and non-cash, stock-based compensation. “Net cash
flows from operating activities” also includes changes in assets and liabilities during the period. “Net cash flows from
operating activities” does not include investing activities or financing activities, nor does it include charges relating to
losses on investing or financing activities. “Net cash flows from operating activities” was $67 million and $489 million
during the years ended December 31, 2002 and 2001, respectively. The decrease in “Net cash flows from operating
activities” was primarily attributable to the $600 million merger termination fee paid to Hughes. Our consolidated
statements of cash flows detail the significant components of “net cash flows from operating activities.”