Dish Network 2002 Annual Report Download - page 35
Download and view the complete annual report
Please find page 35 of the 2002 Dish Network annual report below. You can navigate through the pages in the report by either clicking on the pages listed below, or by using the keyword search tool below to find specific information within the annual report.-
 1
1 -
2
-
3
-
4
-
5
-
6
-
7
-
8
-
9
-
10
-
11
-
12
-
13
-
14
-
15
-
16
-
17
-
18
-
19
-
20
-
21
-
22
-
23
-
24
-
 25
25 -
 26
26 -
 27
27 -
 28
28 -
 29
29 -
 30
30 -
 31
31 -
 32
32 -
 33
33 -
 34
34 -
 35
35 -
 36
36 -
 37
37 -
 38
38 -
 39
39 -
 40
40 -
 41
41 -
 42
42 -
 43
43 -
 44
44 -
 45
45 -
46
-
47
-
48
-
49
-
50
-
51
-
52
-
53
-
54
-
55
-
56
-
57
-
58
-
59
-
60
-
61
-
62
-
63
-
64
-
65
-
66
-
67
-
68
-
69
-
70
-
71
-
72
-
73
-
74
-
75
-
76
-
77
-
78
-
79
-
80
-
81
-
82
-
83
-
84
-
85
-
86
-
87
-
88
-
89
-
90
-
91
-
92
-
93
-
94
-
95
-
96
-
97
-
98
-
99
-
100
-
101
-
102
-
103
 |
 |

33
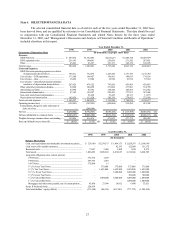
Year Ended December 31
2001 2002
Customer service center and other ............................................ $ 1,767 $ 729
Satellite and transmission .......................................................... 1,115 (7)
General and administrative........................................................ 17,291 10,557
Total non-cash, stock-based compensation ........................... $ 20,173 $ 11,279
Options to purchase an additional 9.1 million shares are outstanding as of December 31, 2002 and were
granted with exercise prices equal to the market value of the underlying shares on the date they were issued during
1999, 2000 and 2001 pursuant to a long term incentive plan under our 1995 Stock Incentive Plan. The weighted-
average exercise price of these options is $8.96. Vesting of these options is contingent upon meeting certain longer-
term goals which have not yet been achieved. Consequently, no compensation was recorded during the year ended
December 31, 2002 related to these long-term options. EchoStar will record the related compensation at the
achievement of the performance goals. Such compensation, if recorded, would likely result in material non-cash,
stock-based compensation expense in our statements of operations.
Pre-Marketing Cash Flow. Pre-marketing cash flow is comprised of EBITDA, as defined below, plus “Cost
of sales – subscriber promotion subsidies,” “Other subscriber promotion subsidies” and “Advertising and other”
expenses. Pre-marketing cash flow was $1.982 billion during the year ended December 31, 2002, an increase of $386
million or 24% compared to the same period in 2001. Our pre-marketing cash flow as a percentage of “Total revenue”
was approximately 41% and 40% during the years ended December 31, 2002 and 2001, respectively.
Earnings Before Interest, Taxes, Depreciation and Amortization. EBITDA is defined as “Operating income
(loss)” plus “Depreciation and amortization,” and is adjusted for “Non-cash, stock-based compensation.” EBITDA was
$806 million during the year ended December 31, 2002, compared to $511 million during the same period in 2001.
The improvement in EBITDA was directly attributable to the increase in the number of DISH Network subscribers,
which continues to result in revenue sufficient to support the cost of new and existing subscribers, and to previously
discussed adjustments totaling approximately $53 million which reduce the costs related to the production of receiver
systems. The improvement was partially offset by a decrease in Digital Home Plan penetration compared to the same
period in 2001, resulting in a reduction in capitalized costs for the period. Our calculation of EBITDA for the years
ended December 31, 2002 and 2001 does not include approximately $11 million and $20 million, respectively, of non-
cash compensation expense resulting from post-grant appreciation of employee stock options. In addition, EBITDA
does not include the impact of capital expenditures under our Digital Home Plan promotion of approximately $278
million and $338 million during 2002 and 2001, respectively. As previously discussed, to the extent we introduce
more aggressive marketing promotions and our subscriber acquisition costs materially increase, our EBITDA results
will be negatively impacted because subscriber acquisition costs are generally expensed as incurred.
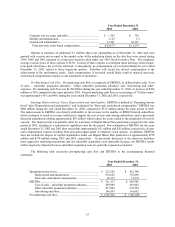
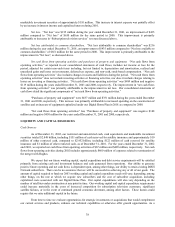
The following table reconciles pre-marketing cash flow and EBITDA to the accompanying financial
statements:
Year Ended December 31,
2001 2002
Operating income (loss)............................................................. $ 212,302 $ 421,348
Depreciation and amortization........................................... 278,652 372,958
Non-cash, stock-based compensation................................ 20,173 11,279
EBITDA..................................................................................... $ 511,127 $ 805,585
Cost of sales – subscriber promotion subsidies................. 459,909 439,863
Other subscriber promotion subsidies ............................... 477,903 574,750
Advertising and other......................................................... 146,563 161,662
Pre-marketing cash flow............................................................ $ 1,595,502 $ 1,981,860