Dish Network 2002 Annual Report Download - page 102
Download and view the complete annual report
Please find page 102 of the 2002 Dish Network annual report below. You can navigate through the pages in the report by either clicking on the pages listed below, or by using the keyword search tool below to find specific information within the annual report.-
 1
1 -
2
-
3
-
4
-
5
-
6
-
7
-
8
-
9
-
10
-
11
-
12
-
13
-
14
-
15
-
16
-
17
-
18
-
19
-
20
-
21
-
22
-
23
-
24
-
25
-
26
-
27
-
28
-
29
-
30
-
31
-
32
-
33
-
34
-
35
-
36
-
37
-
38
-
39
-
40
-
41
-
42
-
43
-
44
-
45
-
46
-
47
-
48
-
49
-
50
-
51
-
52
-
53
-
54
-
55
-
56
-
57
-
58
-
59
-
60
-
61
-
62
-
63
-
64
-
65
-
66
-
67
-
68
-
69
-
70
-
71
-
72
-
73
-
74
-
75
-
76
-
77
-
78
-
79
-
80
-
81
-
82
-
83
-
84
-
85
-
86
-
87
-
88
-
89
-
90
-
91
-
 92
92 -
 93
93 -
 94
94 -
 95
95 -
 96
96 -
 97
97 -
 98
98 -
 99
99 -
 100
100 -
 101
101 -
 102
102 -
 103
103
 |
 |

ECHOSTAR COMMUNICATIONS CORPORATION
NOTES TO CONSOLIDATED FINANCIAL STATEMENTS - Continued
F-42
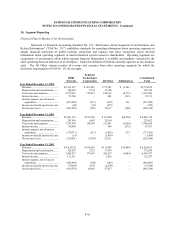
Geographic Information (in thousands) and Transaction with Major Customers
United States Europe Total
2000
Total revenue............................................................. $ 2,667,133 $ 48,087 $ 2,715,220
Long-lived assets, including FCC authorizations ...... 2,217,741 3,546 2,221,287
2001
Total revenue............................................................. $ 3,903,607 $ 97,531 $ 4,001,138
Long-lived assets, including FCC authorizations ..... 2,595,542 4,879 2,600,421
2002
Total revenue............................................................. $ 4,750,782 $ 70,043 $ 4,820,825
Long-lived assets, including FCC authorizations ..... 2,665,130 5,795 2,670,925
Revenues are attributed to geographic regions based upon the location from which the sale originated. United
States revenue includes transactions with both United States and International customers. Europe revenue includes
transactions with customers in Europe, Africa and the Middle East. During the years ended December 31, 2000 and
2001, United States revenue included export sales to two international customers which totaled $187 million and $176
million, respectively. During the year ended December 31, 2002, United States revenue included export sales to one
international customer which totaled $169 million. These international sales accounted for approximately 7%, 4% and
3.5% of EchoStar’s total revenue during each of the years ended December 31, 2000, 2001 and 2002, respectively.
Revenues from these customers are included within the EchoStar Technologies Corporation operating segment.
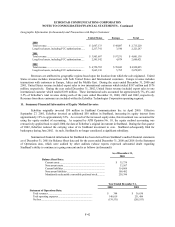
11. Summary Financial Information of Equity Method Investee
EchoStar originally invested $50 million in StarBand Communications Inc. in April 2000. Effective
September 27, 2001, EchoStar invested an additional $50 million in StarBand, increasing its equity interest from
approximately 19% to approximately 32%. As a result of the increased equity stake, this investment was accounted for
using the equity method of accounting. As required by APB Opinion No. 18, the equity method accounting was
retroactively applied back to April 2000, the date of EchoStar’s original investment in StarBand. During the first quarter
of 2002, EchoStar reduced the carrying value of its StarBand investment to zero. StarBand subsequently filed for
bankruptcy during June 2002. As such, StarBand is no longer considered a significant subsidiary.
Summarized financial information for StarBand has been derived from StarBand’s audited financial statements
as of December 31, 2001 for Balance Sheet data and for the years ended December 31, 2000 and 2001 for the Statement
of Operations data, which were audited by other auditors (whose reports expressed substantial doubt regarding
StarBand’s ability to continue as a going concern) and is as follows (in thousands):
As of December 31,
2001
Balance Sheet Data:
Current assets......................................................................... $ 35,738
Noncurrent assets................................................................... 33,567
Current liabilities ................................................................... 114,869
Noncurrent liabilities ............................................................. 109,482
Mandatorily redeemable convertible preferred stock............ 238,394
Year Ended December 31,
2000 2001
Statement of Operations Data:
Total revenues........................................................................ $ 394 $ 36,630
Total operating expenses ....................................................... 140,019 231,486
Net loss................................................................................... (139,531) (205,553)