Cisco 2014 Annual Report Download - page 63
Download and view the complete annual report
Please find page 63 of the 2014 Cisco annual report below. You can navigate through the pages in the report by either clicking on the pages listed below, or by using the keyword search tool below to find specific information within the annual report.-
 1
1 -
2
-
3
-
4
-
5
-
6
-
7
-
8
-
9
-
10
-
11
-
12
-
13
-
14
-
15
-
16
-
17
-
18
-
19
-
20
-
21
-
22
-
23
-
24
-
25
-
26
-
27
-
28
-
29
-
30
-
31
-
32
-
33
-
34
-
35
-
36
-
37
-
38
-
39
-
40
-
41
-
42
-
43
-
44
-
45
-
46
-
47
-
48
-
49
-
50
-
51
-
52
-
 53
53 -
 54
54 -
 55
55 -
 56
56 -
 57
57 -
 58
58 -
 59
59 -
 60
60 -
 61
61 -
 62
62 -
 63
63 -
 64
64 -
 65
65 -
 66
66 -
 67
67 -
 68
68 -
 69
69 -
 70
70 -
 71
71 -
 72
72 -
 73
73 -
74
-
75
-
76
-
77
-
78
-
79
-
80
-
81
-
82
-
83
-
84
-
85
-
86
-
87
-
88
-
89
-
90
-
91
-
92
-
93
-
94
-
95
-
96
-
97
-
98
-
99
-
100
-
101
-
102
-
103
-
104
-
105
-
106
-
107
-
108
-
109
-
110
-
111
-
112
-
113
-
114
-
115
-
116
-
117
-
118
-
119
-
120
-
121
-
122
-
123
-
124
-
125
-
126
-
127
-
128
-
129
-
130
-
131
-
132
-
133
-
134
-
135
-
136
-
137
-
138
-
139
-
140
 |
 |

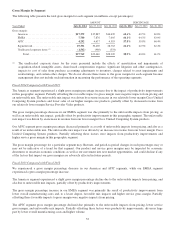
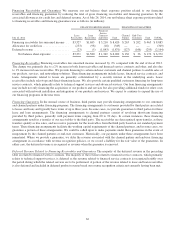
Research and Development (“R&D”), Sales and Marketing, and General and Administrative (“G&A”) Expenses
R&D, sales and marketing, and G&A expenses are summarized in the following table (in millions, except percentages):
Years Ended July 26, 2014 July 27, 2013
Variance
in Dollars
Variance
in Percent July 27, 2013 July 28, 2012
Variance
in Dollars
Variance
in Percent
Research and development .................. $ 6,294 $ 5,942 $ 352 5.9% $ 5,942 $ 5,488 $ 454 8.3%
Percentage of revenue ...................... 13.4% 12.2% 12.2% 11.9%
Sales and marketing ........................ 9,503 9,538 (35) (0.4)% 9,538 9,647 (109) (1.1)%
Percentage of revenue ...................... 20.2% 19.6% 19.6% 20.9%
General and administrative .................. 1,934 2,264 (330) (14.6)% 2,264 2,322 (58) (2.5)%
Percentage of revenue ...................... 4.1% 4.7% 4.7% 5.0%
Total ................................ $17,731 $17,744 $ (13) (0.1)% $17,744 $17,457 $ 287 1.6%
Percentage of revenue .................. 37.6% 36.5% 36.5% 37.9%
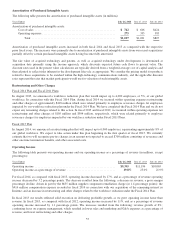
R&D Expenses
Fiscal 2014 Compared with Fiscal 2013
R&D expenses increased for fiscal 2014, as compared with fiscal 2013, primarily due to compensation expense recorded in
fiscal 2014 in connection with our acquisition of the remaining interest in Insieme Networks, Inc. (“Insieme”). See Note 12 to
the Consolidated Financial Statements. Higher share-based compensation expense and higher contracted services also
contributed to the increase. These increases were partially offset by reduced variable compensation expense as a result of our
financial performance and efficiencies related to our workforce reduction plan announced in August 2013.
We continue to invest in R&D in order to bring a broad range of products to market in a timely fashion. If we believe that we
are unable to enter a particular market in a timely manner with internally developed products, we may purchase or license
technology from other businesses, or we may partner with or acquire businesses as an alternative to internal R&D.
Fiscal 2013 Compared with Fiscal 2012
The increase in R&D expenses for fiscal 2013, as compared with fiscal 2012, was primarily due to higher headcount-related
expenses attributable in large part to our acquisitions. Partially offsetting these costs was lower share-based compensation
expense.
Sales and Marketing Expenses
Fiscal 2014 Compared with Fiscal 2013
Sales and marketing expenses for fiscal 2014, as compared with fiscal 2013, decreased slightly due to lower advertising
expenses, reductions in other discretionary spending, and lower expenses in other areas such as depreciation expense. These
decreases were substantially offset by higher share based compensation expense and higher acquisition- related costs.
Fiscal 2013 Compared with Fiscal 2012
For fiscal 2013, as compared with fiscal 2012, sales and marketing expenses decreased by $109 million, primarily due to lower
share-based compensation expense and, to a lesser degree, lower discretionary spending and contracted services. These items
were partially offset by higher headcount-related expense resulting largely from our acquisitions.
G&A Expenses
Fiscal 2014 Compared with Fiscal 2013
G&A expenses decreased in fiscal 2014, as compared with fiscal 2013, due to lower contracted services, lower corporate-level
expenses, and lower headcount-related expenses. The lower headcount-related expenses were due to efficiencies related to our
workforce reduction plan announced in August 2013, and also due to reduced variable compensation expense as a result of our
lower financial performance.
55