Cisco 2014 Annual Report Download - page 58
Download and view the complete annual report
Please find page 58 of the 2014 Cisco annual report below. You can navigate through the pages in the report by either clicking on the pages listed below, or by using the keyword search tool below to find specific information within the annual report.-
 1
1 -
2
-
3
-
4
-
5
-
6
-
7
-
8
-
9
-
10
-
11
-
12
-
13
-
14
-
15
-
16
-
17
-
18
-
19
-
20
-
21
-
22
-
23
-
24
-
25
-
26
-
27
-
28
-
29
-
30
-
31
-
32
-
33
-
34
-
35
-
36
-
37
-
38
-
39
-
40
-
41
-
42
-
43
-
44
-
45
-
46
-
47
-
 48
48 -
 49
49 -
 50
50 -
 51
51 -
 52
52 -
 53
53 -
 54
54 -
 55
55 -
 56
56 -
 57
57 -
 58
58 -
 59
59 -
 60
60 -
 61
61 -
 62
62 -
 63
63 -
 64
64 -
 65
65 -
 66
66 -
 67
67 -
 68
68 -
69
-
70
-
71
-
72
-
73
-
74
-
75
-
76
-
77
-
78
-
79
-
80
-
81
-
82
-
83
-
84
-
85
-
86
-
87
-
88
-
89
-
90
-
91
-
92
-
93
-
94
-
95
-
96
-
97
-
98
-
99
-
100
-
101
-
102
-
103
-
104
-
105
-
106
-
107
-
108
-
109
-
110
-
111
-
112
-
113
-
114
-
115
-
116
-
117
-
118
-
119
-
120
-
121
-
122
-
123
-
124
-
125
-
126
-
127
-
128
-
129
-
130
-
131
-
132
-
133
-
134
-
135
-
136
-
137
-
138
-
139
-
140
 |
 |

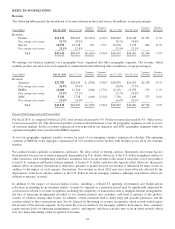
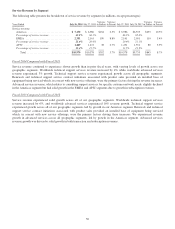
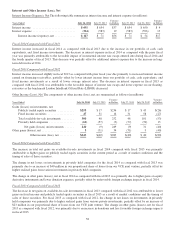
Service Revenue by Segment
The following table presents the breakdown of service revenue by segment (in millions, except percentages):
Years Ended July 26, 2014 July 27, 2013
Variance
in Dollars
Variance
in Percent July 27, 2013 July 28, 2012
Variance
in Dollars
Variance
in Percent
Service revenue:
Americas ............................... $ 7,150 $ 6,986 $164 2.3% $ 6,986 $6,333 $653 10.3%
Percentage of service revenue ............... 65.2% 66.1% 66.1% 65.0%
EMEA ................................. 2,351 2,161 190 8.8% 2,161 2,051 110 5.4%
Percentage of service revenue ............... 21.4% 20.4% 20.4% 21.1%
APJC .................................. 1,469 1,431 38 2.7% 1,431 1,351 80 5.9%
Percentage of service revenue ............... 13.4% 13.5% 13.5% 13.9%
Total ................................ $10,970 $10,578 $392 3.7% $10,578 $9,735 $843 8.7%
Fiscal 2014 Compared with Fiscal 2013
Service revenue continued to experience slower growth than in prior fiscal years, with varying levels of growth across our
geographic segments. Worldwide technical support services revenue increased by 4% while worldwide advanced services
revenue experienced 3% growth. Technical support service revenue experienced growth across all geographic segments.
Renewals and technical support service contract initiations associated with product sales provided an installed base of
equipment being serviced which, in concert with new service offerings, were the primary factors driving the revenue increases.
Advanced services revenue, which relates to consulting support services for specific customer network needs, slightly declined
in the Americas segment but had solid growth in the EMEA and APJC segments due to growth in subscription revenues.
Fiscal 2013 Compared with Fiscal 2012
Service revenue experienced solid growth across all of our geographic segments. Worldwide technical support services
revenue increased by 6%, and worldwide advanced services experienced 16% revenue growth. Technical support service
experienced growth across all of our geographic segments, led by growth in our Americas segment. Renewals and technical
support service contract initiations associated with product sales provided an installed base of equipment being serviced
which, in concert with new service offerings, were the primary factors driving these increases. We experienced revenue
growth in advanced services across all geographic segments, led by growth in the Americas segment. Advanced services
revenue growth was driven by solid growth in both transaction and subscription revenues.
50