Cisco 2014 Annual Report Download - page 52
Download and view the complete annual report
Please find page 52 of the 2014 Cisco annual report below. You can navigate through the pages in the report by either clicking on the pages listed below, or by using the keyword search tool below to find specific information within the annual report.-
 1
1 -
2
-
3
-
4
-
5
-
6
-
7
-
8
-
9
-
10
-
11
-
12
-
13
-
14
-
15
-
16
-
17
-
18
-
19
-
20
-
21
-
22
-
23
-
24
-
25
-
26
-
27
-
28
-
29
-
30
-
31
-
32
-
33
-
34
-
35
-
36
-
37
-
38
-
39
-
40
-
41
-
 42
42 -
 43
43 -
 44
44 -
 45
45 -
 46
46 -
 47
47 -
 48
48 -
 49
49 -
 50
50 -
 51
51 -
 52
52 -
 53
53 -
 54
54 -
 55
55 -
 56
56 -
 57
57 -
 58
58 -
 59
59 -
 60
60 -
 61
61 -
 62
62 -
63
-
64
-
65
-
66
-
67
-
68
-
69
-
70
-
71
-
72
-
73
-
74
-
75
-
76
-
77
-
78
-
79
-
80
-
81
-
82
-
83
-
84
-
85
-
86
-
87
-
88
-
89
-
90
-
91
-
92
-
93
-
94
-
95
-
96
-
97
-
98
-
99
-
100
-
101
-
102
-
103
-
104
-
105
-
106
-
107
-
108
-
109
-
110
-
111
-
112
-
113
-
114
-
115
-
116
-
117
-
118
-
119
-
120
-
121
-
122
-
123
-
124
-
125
-
126
-
127
-
128
-
129
-
130
-
131
-
132
-
133
-
134
-
135
-
136
-
137
-
138
-
139
-
140
 |
 |

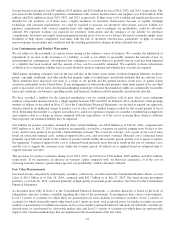
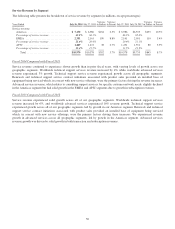
RESULTS OF OPERATIONS
Revenue
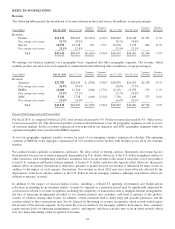
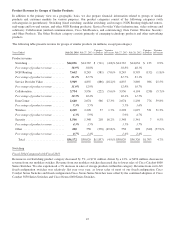
The following table presents the breakdown of revenue between product and service (in millions, except percentages):
Years Ended July 26, 2014 July 27, 2013
Variance
in Dollars
Variance
in Percent July 27, 2013 July 28, 2012
Variance
in Dollars
Variance
in Percent
Revenue:
Product ............... $36,172 $38,029 $(1,857) (4.9)% $38,029 $36,326 $1,703 4.7%
Percentage of revenue ... 76.7% 78.2% 78.2% 78.9%
Service ............... 10,970 10,578 392 3.7% 10,578 9,735 843 8.7%
Percentage of revenue ... 23.3% 21.8% 21.8% 21.1%
Total ............. $47,142 $48,607 $(1,465) (3.0)% $48,607 $46,061 $2,546 5.5%
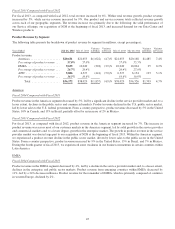
We manage our business primarily on a geographic basis, organized into three geographic segments. Our revenue, which
includes product and service for each segment, is summarized in the following table (in millions, except percentages):
Years Ended July 26, 2014 July 27, 2013
Variance
in Dollars
Variance
in Percent July 27, 2013 July 28, 2012
Variance
in Dollars
Variance
in Percent
Revenue:
Americas ............. $27,781 $28,639 $ (858) (3.0)% $28,639 $26,501 $2,138 8.1%
Percentage of revenue ... 58.9% 58.9% 58.9% 57.5%
EMEA ............... 12,006 12,210 (204) (1.7)% 12,210 12,075 135 1.1%
Percentage of revenue ... 25.5% 25.1% 25.1% 26.2%
APJC ................ 7,355 7,758 (403) (5.2)% 7,758 7,485 273 3.6%
Percentage of revenue ... 15.6% 16.0% 16.0% 16.3%
Total ............. $47,142 $48,607 $(1,465) (3.0)% $48,607 $46,061 $2,546 5.5%
Fiscal 2014 Compared with Fiscal 2013
For fiscal 2014, as compared with fiscal 2013, total revenue decreased by 3%. Product revenue decreased by 5%, while service
revenue increased by 4%. The decrease in product revenue reflected declines across all geographic segments as well as across
all customer markets. Service revenues experienced slower growth in our Americas and APJC geographic segments while we
experienced slightly faster growth in the EMEA segment.
Across our geographic segments, product revenue for most of our emerging countries experienced a decline. The emerging
countries of BRICM, in the aggregate, experienced an 11% product revenue decline, with declines across all of our customer
markets.
We conduct business globally in numerous currencies. The direct effect of foreign currency fluctuations on revenue has not
been material because our revenue is primarily denominated in U.S. dollars. However, if the U.S. dollar strengthens relative to
other currencies, such strengthening could have an indirect effect on our revenue to the extent it raises the cost of our products
to non-U.S. customers and thereby reduces demand. A weaker U.S. dollar could have the opposite effect. However, the precise
indirect effect of currency fluctuations is difficult to measure or predict because our revenue is influenced by many factors in
addition to the impact of such currency fluctuations. Our revenue in fiscal 2014 may have been adversely affected by the
depreciation of the local currency relative to the U.S. dollar in certain emerging countries, although such indirect effects are
difficult to measure, as noted.
In addition to the impact of macroeconomic factors, including a reduced IT spending environment and budget-driven
reductions in spending by government entities, revenue by segment in a particular period may be significantly impacted by
several factors related to revenue recognition, including the complexity of transactions such as multiple-element arrangements;
the mix of financing arrangements provided to our channel partners and customers; and final acceptance of the product,
system, or solution, among other factors. In addition, certain customers tend to make large and sporadic purchases, and the
revenue related to these transactions may also be affected by the timing of revenue recognition, which in turn would impact
the revenue of the relevant segment. As has been the case in certain of our emerging countries from time to time, customers
require greater levels of financing arrangements, service, and support, and these activities may occur in future periods, which
may also impact the timing of the recognition of revenue.
44