Cisco 2014 Annual Report Download - page 42
Download and view the complete annual report
Please find page 42 of the 2014 Cisco annual report below. You can navigate through the pages in the report by either clicking on the pages listed below, or by using the keyword search tool below to find specific information within the annual report.-
 1
1 -
2
-
3
-
4
-
5
-
6
-
7
-
8
-
9
-
10
-
11
-
12
-
13
-
14
-
15
-
16
-
17
-
18
-
19
-
20
-
21
-
22
-
23
-
24
-
25
-
26
-
27
-
28
-
29
-
30
-
31
-
 32
32 -
 33
33 -
 34
34 -
 35
35 -
 36
36 -
 37
37 -
 38
38 -
 39
39 -
 40
40 -
 41
41 -
 42
42 -
 43
43 -
 44
44 -
 45
45 -
 46
46 -
 47
47 -
 48
48 -
 49
49 -
 50
50 -
 51
51 -
 52
52 -
53
-
54
-
55
-
56
-
57
-
58
-
59
-
60
-
61
-
62
-
63
-
64
-
65
-
66
-
67
-
68
-
69
-
70
-
71
-
72
-
73
-
74
-
75
-
76
-
77
-
78
-
79
-
80
-
81
-
82
-
83
-
84
-
85
-
86
-
87
-
88
-
89
-
90
-
91
-
92
-
93
-
94
-
95
-
96
-
97
-
98
-
99
-
100
-
101
-
102
-
103
-
104
-
105
-
106
-
107
-
108
-
109
-
110
-
111
-
112
-
113
-
114
-
115
-
116
-
117
-
118
-
119
-
120
-
121
-
122
-
123
-
124
-
125
-
126
-
127
-
128
-
129
-
130
-
131
-
132
-
133
-
134
-
135
-
136
-
137
-
138
-
139
-
140
 |
 |

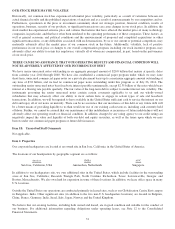
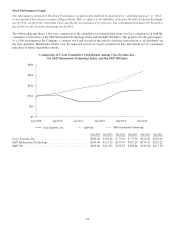
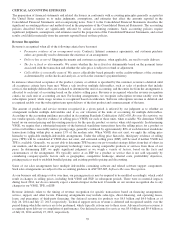
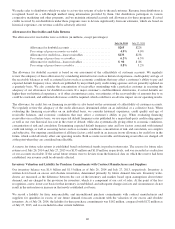
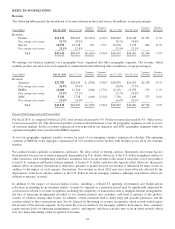
Stock Performance Graph
The information contained in this Stock Performance Graph section shall not be deemed to be “soliciting material” or “filed”
or incorporated by reference in future filings with the SEC, or subject to the liabilities of Section 18 of the Securities Exchange
Act of 1934, except to the extent that Cisco specifically incorporates it by reference into a document filed under the Securities
Act of 1933 or the Securities Exchange Act of 1934.
The following graph shows a five-year comparison of the cumulative total shareholder return on Cisco common stock with the
cumulative total returns of the S&P Information Technology Index and the S&P 500 Index. The graph tracks the performance
of a $100 investment in the Company’s common stock and in each of the indexes (with the reinvestment of all dividends) on
the date specified. Shareholder returns over the indicated period are based on historical data and should not be considered
indicative of future shareholder returns.
Comparison of 5-Year Cumulative Total Return Among Cisco Systems, Inc.,
the S&P Information Technology Index, and the S&P 500 Index
Cisco Systems, Inc. S&P Information Technology
S&P 500
July 2009 July 2010 July 2011 July 2012 July 2013 July 2014
$0
$50
$100
$150
$200
$250
July 2009 July 2010 July 2011 July 2012 July 2013 July 2014
Cisco Systems, Inc. ................................... $100.00 $105.44 $ 73.52 $ 73.36 $122.82 $129.01
S&P Information Technology ........................... $100.00 $113.72 $135.55 $153.25 $170.31 $218.22
S&P500 ........................................... $100.00 $113.83 $136.21 $148.64 $185.80 $217.28
34