Cisco 2014 Annual Report Download - page 49
Download and view the complete annual report
Please find page 49 of the 2014 Cisco annual report below. You can navigate through the pages in the report by either clicking on the pages listed below, or by using the keyword search tool below to find specific information within the annual report.-
 1
1 -
2
-
3
-
4
-
5
-
6
-
7
-
8
-
9
-
10
-
11
-
12
-
13
-
14
-
15
-
16
-
17
-
18
-
19
-
20
-
21
-
22
-
23
-
24
-
25
-
26
-
27
-
28
-
29
-
30
-
31
-
32
-
33
-
34
-
35
-
36
-
37
-
38
-
 39
39 -
 40
40 -
 41
41 -
 42
42 -
 43
43 -
 44
44 -
 45
45 -
 46
46 -
 47
47 -
 48
48 -
 49
49 -
 50
50 -
 51
51 -
 52
52 -
 53
53 -
 54
54 -
 55
55 -
 56
56 -
 57
57 -
 58
58 -
 59
59 -
60
-
61
-
62
-
63
-
64
-
65
-
66
-
67
-
68
-
69
-
70
-
71
-
72
-
73
-
74
-
75
-
76
-
77
-
78
-
79
-
80
-
81
-
82
-
83
-
84
-
85
-
86
-
87
-
88
-
89
-
90
-
91
-
92
-
93
-
94
-
95
-
96
-
97
-
98
-
99
-
100
-
101
-
102
-
103
-
104
-
105
-
106
-
107
-
108
-
109
-
110
-
111
-
112
-
113
-
114
-
115
-
116
-
117
-
118
-
119
-
120
-
121
-
122
-
123
-
124
-
125
-
126
-
127
-
128
-
129
-
130
-
131
-
132
-
133
-
134
-
135
-
136
-
137
-
138
-
139
-
140
 |
 |
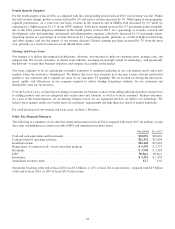
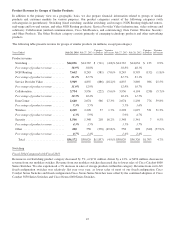
Our provision for inventory was $67 million, $114 million, and $115 million for fiscal 2014, 2013, and 2012, respectively. The
provision for the liability related to purchase commitments with contract manufacturers and suppliers was $124 million, $106
million, and $151 million in fiscal 2014, 2013, and 2012, respectively. If there were to be a sudden and significant decrease in
demand for our products, or if there were a higher incidence of inventory obsolescence because of rapidly changing
technology and customer requirements, we could be required to increase our inventory write-downs, and our liability for
purchase commitments with contract manufacturers and suppliers, and accordingly our profitability, could be adversely
affected. We regularly evaluate our exposure for inventory write-downs and the adequacy of our liability for purchase
commitments. Inventory and supply chain management remain areas of focus as we balance the need to maintain supply chain
flexibility to help ensure competitive lead times with the risk of inventory obsolescence, particularly in light of current
macroeconomic uncertainties and conditions and the resulting potential for changes in future demand forecast.
Loss Contingencies and Product Warranties
We are subject to the possibility of various losses arising in the ordinary course of business. We consider the likelihood of
impairment of an asset or the incurrence of a liability, as well as our ability to reasonably estimate the amount of loss, in
determining loss contingencies. An estimated loss contingency is accrued when it is probable that an asset has been impaired
or a liability has been incurred and the amount of loss can be reasonably estimated. We regularly evaluate information
available to us to determine whether such accruals should be made or adjusted and whether new accruals are required.
Third parties, including customers, have in the past and may in the future assert claims or initiate litigation related to exclusive
patent, copyright, trademark, and other intellectual property rights to technologies and related standards that are relevant to us.
These assertions have increased over time as a result of our growth and the general increase in the pace of patent claims
assertions, particularly in the United States. If any infringement or other intellectual property claim made against us by any third
party is successful, or if we fail to develop non-infringing technology or license the proprietary rights on commercially reasonable
terms and conditions, our business, operating results, and financial condition could be materially and adversely affected.
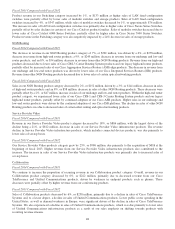
We have recorded a liability for the expected remediation cost for certain products sold in prior fiscal years containing
memory components manufactured by a single supplier between 2005 and 2010. In February 2014, on the basis of the growing
number of failures as described in Note 12 (f) to the Consolidated Financial Statements, we decided to expand our approach,
which resulted in an additional charge to product cost of sales of $655 million being recorded for the second quarter of fiscal
2014. Estimating this liability is complex and subjective, and if we experience changes in a number of underlying assumptions
and estimates such as a change in claims compared with our expectations, or if the cost of servicing these claims is different
than expected, our estimated liability may be impacted.
Our liability for product warranties, included in other current liabilities, was $446 million as of July 26, 2014, compared with
$402 million as of July 27, 2013. Our products are generally covered by a warranty for periods ranging from 90 days to five
years, and for some products we provide a limited lifetime warranty. We accrue for warranty costs as part of our cost of sales
based on associated material costs, technical support labor costs, and associated overhead. Material cost is estimated based
primarily upon historical trends in the volume of product returns within the warranty period and the cost to repair or replace
the equipment. Technical support labor cost is estimated based primarily upon historical trends in the rate of customer cases
and the cost to support the customer cases within the warranty period. Overhead cost is applied based on estimated time to
support warranty activities.
The provision for product warranties during fiscal 2014, 2013, and 2012 was $704 million, $649 million, and $617 million,
respectively. If we experience an increase in warranty claims compared with our historical experience, or if the cost of
servicing warranty claims is greater than expected, our profitability could be adversely affected.
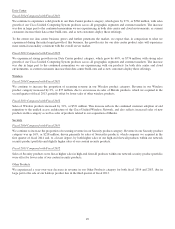
Fair Value Measurements
Our fixed income and publicly traded equity securities, collectively, are reflected in the Consolidated Balance Sheets at a fair
value of $45.3 billion as of July 26, 2014, compared with $42.7 billion as of July 27, 2013. Our fixed income investment
portfolio, as of July 26, 2014, consisted primarily of high quality investment-grade securities. See Note 8 to the Consolidated
Financial Statements.
As described more fully in Note 2 to the Consolidated Financial Statements, a valuation hierarchy is based on the level of
independent, objective evidence available regarding the value of the investments. It encompasses three classes of investments:
Level 1 consists of securities for which there are quoted prices in active markets for identical securities; Level 2 consists of
securities for which observable inputs other than Level 1 inputs are used, such as quoted prices for similar securities in active
markets or quoted prices for identical securities in less active markets and model-derived valuations for which the variables are
derived from, or corroborated by, observable market data; and Level 3 consists of securities for which there are unobservable
inputs to the valuation methodology that are significant to the measurement of the fair value.
41