Cisco 2014 Annual Report Download - page 60
Download and view the complete annual report
Please find page 60 of the 2014 Cisco annual report below. You can navigate through the pages in the report by either clicking on the pages listed below, or by using the keyword search tool below to find specific information within the annual report.-
 1
1 -
2
-
3
-
4
-
5
-
6
-
7
-
8
-
9
-
10
-
11
-
12
-
13
-
14
-
15
-
16
-
17
-
18
-
19
-
20
-
21
-
22
-
23
-
24
-
25
-
26
-
27
-
28
-
29
-
30
-
31
-
32
-
33
-
34
-
35
-
36
-
37
-
38
-
39
-
40
-
41
-
42
-
43
-
44
-
45
-
46
-
47
-
48
-
49
-
 50
50 -
 51
51 -
 52
52 -
 53
53 -
 54
54 -
 55
55 -
 56
56 -
 57
57 -
 58
58 -
 59
59 -
 60
60 -
 61
61 -
 62
62 -
 63
63 -
 64
64 -
 65
65 -
 66
66 -
 67
67 -
 68
68 -
 69
69 -
 70
70 -
71
-
72
-
73
-
74
-
75
-
76
-
77
-
78
-
79
-
80
-
81
-
82
-
83
-
84
-
85
-
86
-
87
-
88
-
89
-
90
-
91
-
92
-
93
-
94
-
95
-
96
-
97
-
98
-
99
-
100
-
101
-
102
-
103
-
104
-
105
-
106
-
107
-
108
-
109
-
110
-
111
-
112
-
113
-
114
-
115
-
116
-
117
-
118
-
119
-
120
-
121
-
122
-
123
-
124
-
125
-
126
-
127
-
128
-
129
-
130
-
131
-
132
-
133
-
134
-
135
-
136
-
137
-
138
-
139
-
140
 |
 |

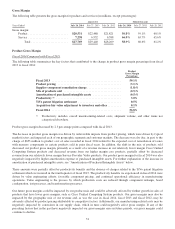
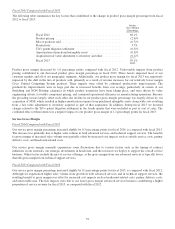
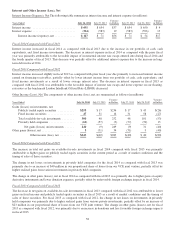
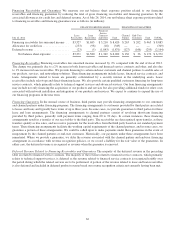
Fiscal 2013 Compared with Fiscal 2012
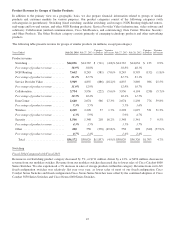
The following table summarizes the key factors that contributed to the change in product gross margin percentage from fiscal
2012 to fiscal 2013:
Product
Gross Margin
Percentage
Fiscal 2012 ................................................ 60.1%
Product pricing ............................................. (2.9)%
Mix of products sold ......................................... (0.7)%
Productivity ................................................ 3.7%
TiVo patent litigation settlement ................................ (0.5)%
Amortization of purchased intangible assets ...................... (0.5)%
Acquisition fair value adjustment to inventory and other ............. (0.1)%
Fiscal 2013 ................................................ 59.1%
Product gross margin decreased by 1.0 percentage points compared with fiscal 2012. Unfavorable impacts from product
pricing contributed to our decreased product gross margin percentage in fiscal 2013. These factors impacted most of our
customer markets and all of our geographic segments. Additionally, our product gross margin for fiscal 2013 was negatively
impacted by the shift in the mix of products sold, primarily as a result of revenue increases for our relatively lower margin
Cisco Unified Computing System products. These impacts were offset by continued productivity improvements. The
productivity improvements were in large part due to increased benefits from cost savings, particularly in certain of our
Switching and NGN Routing categories in which product transitions have been taking place, and were driven by value
engineering efforts, favorable component pricing, and continued operational efficiency in manufacturing operations. Because
the preceding factors largely offset each other, the decline in our product gross margin percentage was largely driven by our
acquisition of NDS, which resulted in higher amortization expense from purchased intangible assets along with costs resulting
from a fair value adjustment to inventory acquired as part of that acquisition. In addition, during fiscal 2013 we incurred
charges related to the TiVo patent litigation settlement in the fourth quarter that were included as part of cost of sales. The
combined effect of these items was a negative impact to our product gross margin of 1.1 percentage points for fiscal 2013.
Service Gross Margin
Fiscal 2014 Compared with Fiscal 2013
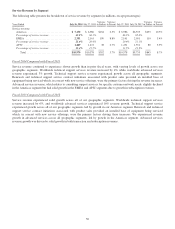
Our service gross margin percentage increased slightly by 0.3 percentage points for fiscal 2014, as compared with fiscal 2013.
The increase was primarily due to higher sales volume in both advanced services and technical support services. The benefits
to gross margin of increased sales volume were partially offset by increased cost impacts such as outside service costs, partner
delivery costs, and headcount-related costs.
Our service gross margin normally experiences some fluctuations due to various factors such as the timing of contract
initiations in our renewals, our strategic investments in headcount, and the resources we deploy to support the overall service
business. Other factors include the mix of service offerings, as the gross margin from our advanced services is typically lower
than the gross margin from technical support services.
Fiscal 2013 Compared with Fiscal 2012
Our service gross margin percentage increased slightly by 0.1 percentage points for fiscal 2013, as compared with fiscal 2012.
Although we experienced higher sales volume from growth in both advanced services and in technical support services, the
resulting benefit to gross margin was offset by increased cost impacts such as headcount-related costs, partner delivery costs,
and unfavorable mix. The mix impacts were due to our lower gross margin advanced services business contributing a higher
proportion of service revenue for fiscal 2013, as compared with fiscal 2012.
52