Cisco 2014 Annual Report Download - page 128
Download and view the complete annual report
Please find page 128 of the 2014 Cisco annual report below. You can navigate through the pages in the report by either clicking on the pages listed below, or by using the keyword search tool below to find specific information within the annual report.-
 1
1 -
2
-
3
-
4
-
5
-
6
-
7
-
8
-
9
-
10
-
11
-
12
-
13
-
14
-
15
-
16
-
17
-
18
-
19
-
20
-
21
-
22
-
23
-
24
-
25
-
26
-
27
-
28
-
29
-
30
-
31
-
32
-
33
-
34
-
35
-
36
-
37
-
38
-
39
-
40
-
41
-
42
-
43
-
44
-
45
-
46
-
47
-
48
-
49
-
50
-
51
-
52
-
53
-
54
-
55
-
56
-
57
-
58
-
59
-
60
-
61
-
62
-
63
-
64
-
65
-
66
-
67
-
68
-
69
-
70
-
71
-
72
-
73
-
74
-
75
-
76
-
77
-
78
-
79
-
80
-
81
-
82
-
83
-
84
-
85
-
86
-
87
-
88
-
89
-
90
-
91
-
92
-
93
-
94
-
95
-
96
-
97
-
98
-
99
-
100
-
101
-
102
-
103
-
104
-
105
-
106
-
107
-
108
-
109
-
110
-
111
-
112
-
113
-
114
-
115
-
116
-
117
-
 118
118 -
 119
119 -
 120
120 -
 121
121 -
 122
122 -
 123
123 -
 124
124 -
 125
125 -
 126
126 -
 127
127 -
 128
128 -
 129
129 -
 130
130 -
 131
131 -
 132
132 -
 133
133 -
 134
134 -
 135
135 -
 136
136 -
 137
137 -
 138
138 -
139
-
140
 |
 |

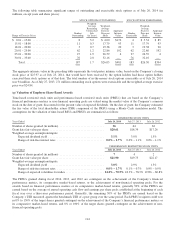
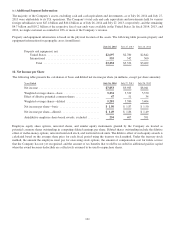
Summarized financial information by segment for fiscal 2014, 2013, and 2012, based on the Company’s internal management
system and as utilized by the Company’s Chief Operating Decision Maker (“CODM”), is as follows (in millions):
Years Ended July 26, 2014 July 27, 2013 July 28, 2012
Revenue:
Americas ....................................... $27,781 $28,639 $26,501
EMEA ......................................... 12,006 12,210 12,075
APJC .......................................... 7,355 7,758 7,485
Total ...................................... $47,142 $48,607 $46,061
Gross margin:
Americas ....................................... $17,379 $17,887 $16,639
EMEA ......................................... 7,700 7,876 7,605
APJC .......................................... 4,252 4,637 4,519
Segment total ............................... 29,331 30,400 28,763
Unallocated corporate items ............................ (1,562) (960) (554)
Total ...................................... $27,769 $29,440 $28,209
Revenue in the United States was $24.3 billion, $24.6 billion, and $22.6 billion for fiscal 2014, 2013, and 2012, respectively.
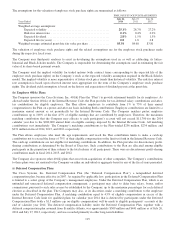
(b) Revenue for Groups of Similar Products and Services
The Company designs, manufactures, and sells Internet Protocol (IP)-based networking and other products related to the
communications and IT industry and provides services associated with these products and their use. The Company groups its
products and technologies into the following categories: Switching, NGN Routing, Service Provider Video, Collaboration,
Data Center, Wireless, Security, and Other Products. These products, primarily integrated by Cisco IOS Software, link
geographically dispersed local-area networks (LANs), metropolitan-area networks (MANs), and wide-area networks (WANs).
The following table presents revenue for groups of similar products and services (in millions):
Years Ended July 26, 2014 July 27, 2013 July 28, 2012
Revenue:
Switching ...................................... $14,056 $14,767 $14,634
NGN Routing ................................... 7,662 8,243 8,395
Service Provider Video ........................... 3,969 4,855 3,869
Collaboration ................................... 3,734 3,956 4,194
Data Center ..................................... 2,640 2,074 1,298
Wireless ....................................... 2,265 2,228 1,697
Security ........................................ 1,566 1,348 1,341
Other .......................................... 280 558 898
Product .................................... 36,172 38,029 36,326
Service .................................... 10,970 10,578 9,735
Total .................................. $47,142 $48,607 $46,061
The Company has made certain reclassifications to the product revenue amounts for prior years to conform to the current
year’s presentation.
120