Cincinnati Bell 2006 Annual Report Download - page 51
Download and view the complete annual report
Please find page 51 of the 2006 Cincinnati Bell annual report below. You can navigate through the pages in the report by either clicking on the pages listed below, or by using the keyword search tool below to find specific information within the annual report.-
 1
1 -
2
-
3
-
4
-
5
-
6
-
7
-
8
-
9
-
10
-
11
-
12
-
13
-
14
-
15
-
16
-
17
-
18
-
19
-
20
-
21
-
22
-
23
-
24
-
25
-
26
-
27
-
28
-
29
-
30
-
31
-
32
-
33
-
34
-
35
-
36
-
37
-
38
-
39
-
40
-
 41
41 -
 42
42 -
 43
43 -
 44
44 -
 45
45 -
 46
46 -
 47
47 -
 48
48 -
 49
49 -
 50
50 -
 51
51 -
 52
52 -
 53
53 -
 54
54 -
 55
55 -
 56
56 -
 57
57 -
 58
58 -
 59
59 -
 60
60 -
 61
61 -
62
-
63
-
64
-
65
-
66
-
67
-
68
-
69
-
70
-
71
-
72
-
73
-
74
-
75
-
76
-
77
-
78
-
79
-
80
-
81
-
82
-
83
-
84
-
85
-
86
-
87
-
88
-
89
-
90
-
91
-
92
-
93
-
94
-
95
-
96
-
97
-
98
-
99
-
100
-
101
-
102
-
103
-
104
-
105
-
106
-
107
-
108
-
109
-
110
-
111
-
112
-
113
-
114
-
115
-
116
-
117
-
118
-
119
-
120
-
121
-
122
-
123
-
124
-
125
-
126
-
127
-
128
-
129
-
130
-
131
-
132
-
133
-
134
-
135
-
136
-
137
-
138
-
139
-
140
-
141
-
142
-
143
-
144
-
145
-
146
-
147
-
148
-
149
-
150
-
151
-
152
-
153
-
154
-
155
-
156
-
157
-
158
-
159
-
160
-
161
-
162
-
163
-
164
-
165
-
166
-
167
-
168
-
169
-
170
-
171
-
172
-
173
-
174
-
175
-
176
-
177
-
178
-
179
-
180
-
181
-
182
-
183
-
184
-
185
-
186
-
187
-
188
-
189
-
190
-
191
-
192
-
193
-
194
-
195
-
196
-
197
-
198
-
199
-
200
-
201
-
202
-
203
-
204
-
205
-
206
-
207
-
208
-
209
-
210
-
211
-
212
-
213
-
214
-
215
-
216
-
217
-
218
-
219
-
220
-
221
-
222
-
223
-
224
-
225
-
226
-
227
-
228
 |
 |

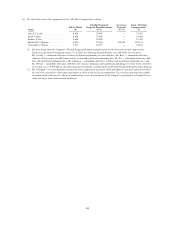
The Compensation Committee also wants to ensure that each executive has a significant percentage of
compensation “at risk.” Using the benchmark data, input from its own independent consultant as well as from
Company management (primarily the Chief Executive Officer and Vice President of Human Resources &
Administration), the Committee allocates total target direct compensation among base salary, annual bonus and
long-term incentive compensation. For 2006, the Chief Executive Officer’s base salary represented
approximately 45% of total target cash compensation and approximately 19% of total target direct compensation.
For the other executive officers named in this proxy statement, their base salary represented between 54% and
69% of total target cash compensation and between 31% and 54% of total target direct compensation. Based on
marketplace practices, combined with the Compensation Committee members’ collective experience, the
Compensation Committee believes that this allocation of pay between base pay and short term and long term
incentive compensation provides a fair balance. It results in a base rate of pay that considers the external market,
internal equity and the executive’s individual performance, an appropriate incentive to achieve objectives set for
the current year while also providing a significant incentive that requires the executives to make decisions that
are intended to sustain attainment of business objectives over the longer term.
As part of the process for setting compensation for 2007 and future years, the Compensation Committee, in
late 2006, began reviewing “tally sheets” for each of the executives. Tally sheets provide the Compensation
Committee with detailed information, as of a given date, about each executive’s current compensation (including
the annualized value of any applicable benefit programs), a current accounting of the value of accrued/vested pay
that includes the value of shares of Company stock owned by the executive, the value of any vested stock options
and any other forms of equity, the vested value of any retirement benefits provided by the Company, and pay
and/or benefits triggered under a variety of employment termination scenarios. This provides additional context
for the Compensation Committee in setting future pay levels.
Determination of Amounts for Each Compensation Element
Base salary
An executive’s base salary is determined by an assessment of his/her performance against his/her individual
job responsibilities, the executive’s effectiveness in identifying and developing future management talent, and
such other factors as the Chief Executive Officer or the Compensation Committee deems relevant for such
individual executive, all of which are considered in relation to the 50th percentile market base salary data for
such position provided in the Towers Perrin information.
For all positions other than Chief Executive Officer, the Chief Executive Officer recommends such other
executives’ base salary, and the Committee considers such recommendations and determines the base salaries.
Similarly, the Company’s Chairman of the Board solicits input from each of the other Directors regarding
the Chief Executive Officer’s performance during the year. In executive session, the Chairman of the Board
provides the Committee with a summary of the input received for further discussion. The Compensation
Committee’s independent consultant reviews the annual executive compensation study for the Chief Executive
Officer’s position. Based on these factors, the Committee determines what adjustments in base salary to
recommend for approval to the full Board.
Annual Incentive
Payments under the Company’s annual incentive plan are tied to:
(i) the Company’s level of achievement of (a) earnings before interest, taxes, depreciation and
amortization (“EBITDA”) and (b) revenues and
(ii) the executive’s individual performance.
The Company has selected these measures because it believes that investors use these measures to evaluate
financial performance and because they also indicate the level of success with its strategy to de-lever, defend and
grow. EBITDA is a common measure of the profitability employed in the telecommunications and other capital-
intensive industries. To compute the annual bonus for each executive, the Company uses reported revenue and
EBITDA. The Compensation Committee and the Board review and approve these calculations. In conjunction, it
may adjust the calculated result and/or goal amount for a change in business direction or an unanticipated event.
39
Proxy Statement