Cincinnati Bell 2006 Annual Report Download - page 201
Download and view the complete annual report
Please find page 201 of the 2006 Cincinnati Bell annual report below. You can navigate through the pages in the report by either clicking on the pages listed below, or by using the keyword search tool below to find specific information within the annual report.-
 1
1 -
2
-
3
-
4
-
5
-
6
-
7
-
8
-
9
-
10
-
11
-
12
-
13
-
14
-
15
-
16
-
17
-
18
-
19
-
20
-
21
-
22
-
23
-
24
-
25
-
26
-
27
-
28
-
29
-
30
-
31
-
32
-
33
-
34
-
35
-
36
-
37
-
38
-
39
-
40
-
41
-
42
-
43
-
44
-
45
-
46
-
47
-
48
-
49
-
50
-
51
-
52
-
53
-
54
-
55
-
56
-
57
-
58
-
59
-
60
-
61
-
62
-
63
-
64
-
65
-
66
-
67
-
68
-
69
-
70
-
71
-
72
-
73
-
74
-
75
-
76
-
77
-
78
-
79
-
80
-
81
-
82
-
83
-
84
-
85
-
86
-
87
-
88
-
89
-
90
-
91
-
92
-
93
-
94
-
95
-
96
-
97
-
98
-
99
-
100
-
101
-
102
-
103
-
104
-
105
-
106
-
107
-
108
-
109
-
110
-
111
-
112
-
113
-
114
-
115
-
116
-
117
-
118
-
119
-
120
-
121
-
122
-
123
-
124
-
125
-
126
-
127
-
128
-
129
-
130
-
131
-
132
-
133
-
134
-
135
-
136
-
137
-
138
-
139
-
140
-
141
-
142
-
143
-
144
-
145
-
146
-
147
-
148
-
149
-
150
-
151
-
152
-
153
-
154
-
155
-
156
-
157
-
158
-
159
-
160
-
161
-
162
-
163
-
164
-
165
-
166
-
167
-
168
-
169
-
170
-
171
-
172
-
173
-
174
-
175
-
176
-
177
-
178
-
179
-
180
-
181
-
182
-
183
-
184
-
185
-
186
-
187
-
188
-
189
-
190
-
 191
191 -
 192
192 -
 193
193 -
 194
194 -
 195
195 -
 196
196 -
 197
197 -
 198
198 -
 199
199 -
 200
200 -
 201
201 -
 202
202 -
 203
203 -
 204
204 -
 205
205 -
 206
206 -
 207
207 -
 208
208 -
 209
209 -
 210
210 -
 211
211 -
212
-
213
-
214
-
215
-
216
-
217
-
218
-
219
-
220
-
221
-
222
-
223
-
224
-
225
-
226
-
227
-
228
 |
 |

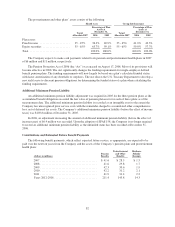
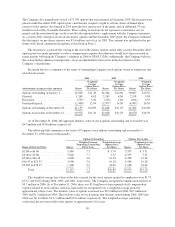
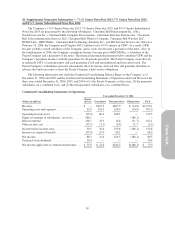
The fair values at the date of grant were estimated using the Black-Scholes option-pricing model with the
following weighted-average assumptions:
2006 2005 2004
Expected volatility ........................................ 29.7% 32.0% 35.0%
Risk-free interest rate ...................................... 4.5% 4.3% 2.9%
Expected holding period — years ............................543
Expected dividends ....................................... 0.0% 0.0% 0.0%
The expected volatility assumption used in the Black-Scholes pricing model was based on historical
volatility. The risk-free rate is based on the U.S. Treasury yield curve in effect at the time of grant. The expected
holding period was estimated using the historical exercise behavior of employees and adjusted for abnormal
activity. The increase in the holding period is primarily attributed to the change in demographics for the
employees who received the awards. Expected dividends are based on the Company’s history of paying
dividends, as well as restrictions in place under the Company’s debt covenants. The Company’s policy for graded
vesting awards is to recognize compensation expense on a straight-line basis over the vesting period.
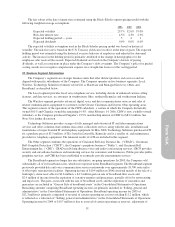
15. Business Segment Information
The Company’s segments are strategic business units that offer distinct products and services and are
aligned with specific subsidiaries of the Company. The Company operates in five business segments: Local,
Wireless, Technology Solutions (formerly referred to as Hardware and Managed Services), Other, and
Broadband, as described below.
The Local segment provides local voice telephone service, including dozens of enhanced custom calling
features, and data services, to customers in southwestern Ohio, northern Kentucky and southeastern Indiana.
The Wireless segment provides advanced, digital voice and data communications services and sales of
related communications equipment to customers in the Greater Cincinnati and Dayton, Ohio operating areas.
This segment consists of the operations of the CBW subsidiary, a venture in which the Company historically
owned 80.1% and Cingular owned the remaining 19.9%. After February 14, 2006, CBW is now a wholly-owned
subsidiary as the Company purchased Cingular’s 19.9% membership interest in CBW for $83.2 million. See
Note 5 for further discussion.
Technology Solutions provides a range of fully managed and outsourced IT and telecommunications
services and offers solutions that combine data center collocation services along with the sale, installation and
maintenance of major branded IT and telephony equipment. In May 2006, Technology Solutions purchased ATI
for a purchase price of $3.5 million. ATI is based in Louisville, Kentucky and is a reseller of, and maintenance
provider for, telephony equipment. The financial results of ATI are included in this segment.
The Other segment combines the operations of Cincinnati Bell Any Distance Inc. (“CBAD”), Cincinnati
Bell Complete Protection (“CBCP”), the Company’s payphone business (“Public”), and Cincinnati Bell
Entertainment Inc. (“CBE”). CBAD resells long distance voice and audio-conferencing services, CBCP provides
security and surveillance hardware and monitoring services for consumers and businesses, Public provides public
payphone services, and CBE has been established to eventually provide entertainment services.
The Broadband segment no longer has any substantive, on-going operations. In 2003, the Company sold
substantially all of its broadband assets, which were reported in the Broadband segment. The Broadband segment
previously provided data and voice communication services nationwide over approximately 18,700 route miles
of fiber-optic transmission facilities. Operating income of $10.4 million in 2006 consisted mainly of the sale of a
bankruptcy claim receivable for $3.6 million, a $4.7 million gain on sale of broadband fiber assets and
$2.9 million of income from the expiration of certain warranties and guarantees, partially offset by restructuring
and legal costs. The gains associated with the sale of broadband assets and the expiration of warranties and
guarantees are included in “Gain on Sale of broadband assets” in the Consolidated Statements of Operations.
Remaining amounts comprising Broadband operating income are primarily included in “Selling, general and
administrative” in the Consolidated Statements of Operations. Broadband operating income for 2005 of
$12.3 million is primarily comprised of reversal of certain operating tax reserves totaling $11.2 million, which
is reflected as a reduction of “Selling, general and administrative” in the Consolidated Statements of Operations.
Operating income for 2004 of $10.7 million is due to reversal of certain operating tax reserves, adjustment of
91