Cincinnati Bell 2006 Annual Report Download - page 204
Download and view the complete annual report
Please find page 204 of the 2006 Cincinnati Bell annual report below. You can navigate through the pages in the report by either clicking on the pages listed below, or by using the keyword search tool below to find specific information within the annual report.-
 1
1 -
2
-
3
-
4
-
5
-
6
-
7
-
8
-
9
-
10
-
11
-
12
-
13
-
14
-
15
-
16
-
17
-
18
-
19
-
20
-
21
-
22
-
23
-
24
-
25
-
26
-
27
-
28
-
29
-
30
-
31
-
32
-
33
-
34
-
35
-
36
-
37
-
38
-
39
-
40
-
41
-
42
-
43
-
44
-
45
-
46
-
47
-
48
-
49
-
50
-
51
-
52
-
53
-
54
-
55
-
56
-
57
-
58
-
59
-
60
-
61
-
62
-
63
-
64
-
65
-
66
-
67
-
68
-
69
-
70
-
71
-
72
-
73
-
74
-
75
-
76
-
77
-
78
-
79
-
80
-
81
-
82
-
83
-
84
-
85
-
86
-
87
-
88
-
89
-
90
-
91
-
92
-
93
-
94
-
95
-
96
-
97
-
98
-
99
-
100
-
101
-
102
-
103
-
104
-
105
-
106
-
107
-
108
-
109
-
110
-
111
-
112
-
113
-
114
-
115
-
116
-
117
-
118
-
119
-
120
-
121
-
122
-
123
-
124
-
125
-
126
-
127
-
128
-
129
-
130
-
131
-
132
-
133
-
134
-
135
-
136
-
137
-
138
-
139
-
140
-
141
-
142
-
143
-
144
-
145
-
146
-
147
-
148
-
149
-
150
-
151
-
152
-
153
-
154
-
155
-
156
-
157
-
158
-
159
-
160
-
161
-
162
-
163
-
164
-
165
-
166
-
167
-
168
-
169
-
170
-
171
-
172
-
173
-
174
-
175
-
176
-
177
-
178
-
179
-
180
-
181
-
182
-
183
-
184
-
185
-
186
-
187
-
188
-
189
-
190
-
191
-
192
-
193
-
 194
194 -
 195
195 -
 196
196 -
 197
197 -
 198
198 -
 199
199 -
 200
200 -
 201
201 -
 202
202 -
 203
203 -
 204
204 -
 205
205 -
 206
206 -
 207
207 -
 208
208 -
 209
209 -
 210
210 -
 211
211 -
 212
212 -
 213
213 -
 214
214 -
215
-
216
-
217
-
218
-
219
-
220
-
221
-
222
-
223
-
224
-
225
-
226
-
227
-
228
 |
 |

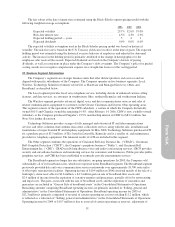
16. Supplemental Cash Flow Information
Year ended December 31,
(dollars in millions) 2006 2005 2004
Capitalized interest expense ........................... $ 1.0 $ 0.6 $ 0.6
Cash paid for:
Interest ......................................... 153.7 155.1 158.8
Income taxes (net of refunds) ........................ 6.6 2.1 2.3
Noncash investing and financing activities:
Increase in assets due to capital lease transactions ....... (5.2) (11.4) —
Increase in liabilities due to capital lease transactions ..... 5.2 11.4 —
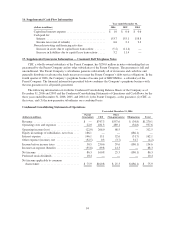
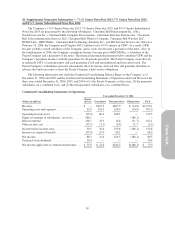
17. Supplemental Guarantor Information — Cincinnati Bell Telephone Notes
CBT, a wholly-owned subsidiary of the Parent Company, has $230.0 million in notes outstanding that are
guaranteed by the Parent Company and no other subsidiaries of the Parent Company. The guarantee is full and
unconditional. The Parent Company’s subsidiaries generate substantially all of its income and cash flow and
generally distribute or advance the funds necessary to meet the Parent Company’s debt service obligations. In the
fourth quarter of 2006, the Company’s payphone business became part of BRCOM Inc., a subsidiary of the
Parent Company. The financial information presented below combines the Company’s payphone business with
the non-guarantors for all periods presented.
The following information sets forth the Condensed Consolidating Balance Sheets of the Company as of
December 31, 2006 and 2005 and the Condensed Consolidating Statements of Operations and Cash Flows for the
three years ended December 31, 2006, 2005, and 2004 of (1) the Parent Company, as the guarantor, (2) CBT, as
the issuer, and (3) the non-guarantor subsidiaries on a combined basis:
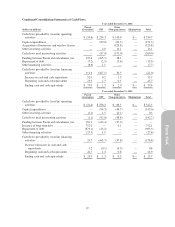
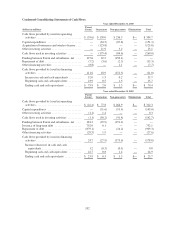
Condensed Consolidating Statements of Operations
Year ended December 31, 2006
(dollars in millions)
Parent
(Guarantor) CBT
Other
(Non-guarantors) Eliminations Total
Revenue ................................ $ — $747.3 $557.6 $ (34.8) $1,270.1
Operating costs and expenses ............... 22.0 481.3 489.1 (34.8) 957.6
Operating income (loss) .................... (22.0) 266.0 68.5 — 312.5
Equity in earnings of subsidiaries, net of tax .... 186.1 — — (186.1) —
Interest expense .......................... 146.1 15.1 32.6 (31.7) 162.1
Other expense (income), net ................ (32.5) 0.3 (3.7) 31.7 (4.2)
Income before income taxes ................ 50.5 250.6 39.6 (186.1) 154.6
Income tax expense (benefit) ................ (35.8) 89.8 14.3 — 68.3
Net income ............................. 86.3 160.8 25.3 (186.1) 86.3
Preferred stock dividends ................... 10.4 — — — 10.4
Net income applicable to common
shareowners ........................... $ 75.9 $160.8 $ 25.3 $(186.1) $ 75.9
94