Cincinnati Bell 2006 Annual Report Download - page 178
Download and view the complete annual report
Please find page 178 of the 2006 Cincinnati Bell annual report below. You can navigate through the pages in the report by either clicking on the pages listed below, or by using the keyword search tool below to find specific information within the annual report.-
 1
1 -
2
-
3
-
4
-
5
-
6
-
7
-
8
-
9
-
10
-
11
-
12
-
13
-
14
-
15
-
16
-
17
-
18
-
19
-
20
-
21
-
22
-
23
-
24
-
25
-
26
-
27
-
28
-
29
-
30
-
31
-
32
-
33
-
34
-
35
-
36
-
37
-
38
-
39
-
40
-
41
-
42
-
43
-
44
-
45
-
46
-
47
-
48
-
49
-
50
-
51
-
52
-
53
-
54
-
55
-
56
-
57
-
58
-
59
-
60
-
61
-
62
-
63
-
64
-
65
-
66
-
67
-
68
-
69
-
70
-
71
-
72
-
73
-
74
-
75
-
76
-
77
-
78
-
79
-
80
-
81
-
82
-
83
-
84
-
85
-
86
-
87
-
88
-
89
-
90
-
91
-
92
-
93
-
94
-
95
-
96
-
97
-
98
-
99
-
100
-
101
-
102
-
103
-
104
-
105
-
106
-
107
-
108
-
109
-
110
-
111
-
112
-
113
-
114
-
115
-
116
-
117
-
118
-
119
-
120
-
121
-
122
-
123
-
124
-
125
-
126
-
127
-
128
-
129
-
130
-
131
-
132
-
133
-
134
-
135
-
136
-
137
-
138
-
139
-
140
-
141
-
142
-
143
-
144
-
145
-
146
-
147
-
148
-
149
-
150
-
151
-
152
-
153
-
154
-
155
-
156
-
157
-
158
-
159
-
160
-
161
-
162
-
163
-
164
-
165
-
166
-
167
-
 168
168 -
 169
169 -
 170
170 -
 171
171 -
 172
172 -
 173
173 -
 174
174 -
 175
175 -
 176
176 -
 177
177 -
 178
178 -
 179
179 -
 180
180 -
 181
181 -
 182
182 -
 183
183 -
 184
184 -
 185
185 -
 186
186 -
 187
187 -
 188
188 -
189
-
190
-
191
-
192
-
193
-
194
-
195
-
196
-
197
-
198
-
199
-
200
-
201
-
202
-
203
-
204
-
205
-
206
-
207
-
208
-
209
-
210
-
211
-
212
-
213
-
214
-
215
-
216
-
217
-
218
-
219
-
220
-
221
-
222
-
223
-
224
-
225
-
226
-
227
-
228
 |
 |

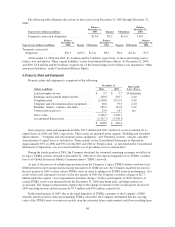
The following table illustrates the activity in this reserve from December 31, 2003 through December 31,
2006:
Type of costs (dollars in millions)
Balance
December 31,
2003 Expense Utilizations
Balance
December 31,
2004
Terminate contractual obligations ........... $13.8 $0.2 $(3.9) $10.1
Type of costs (dollars in millions)
Balance
December 31,
2004 Income Utilizations
Balance
December 31,
2005 Expense Utilizations
Balance
December 31,
2006
Terminate contractual
obligations .............. $10.1 $(0.5) $(1.4) $8.2 $0.6 $(1.6) $7.2
At December 31, 2006 and 2005, $1.4 million and $1.3 million, respectively, of the restructuring reserve
balance was included in “Other current liabilities” in the Consolidated Balance Sheets. At December 31, 2006
and 2005, $5.8 million and $6.9 million, respectively, of the restructuring reserve balance was included in “Other
noncurrent liabilities” in the Consolidated Balance Sheets.
4. Property, Plant and Equipment
Property, plant and equipment is comprised of the following:
December 31, Depreciable
Lives (Years)(dollars in millions) 2006 2005
Land and rights-of-way ..................... $ 5.7 $ 5.7 20-Indefinite
Buildings and leasehold improvements ......... 220.0 205.7 2-40
Telephone plant ........................... 2,148.8 2,071.9 5-50
Computer and telecommunications equipment . . . 56.8 79.3 2-20
Furniture, fixtures, vehicles, and other ......... 130.2 121.8 5-20
Construction in process ..................... 25.0 24.7 n/a
Gross value .............................. 2,586.5 2,509.1
Accumulated depreciation ................... (1,767.7) (1,708.7)
$ 818.8 $ 800.4
Gross property, plant and equipment includes $32.3 million and $30.7 million of assets accounted for as
capital leases in 2006 and 2005, respectively. These assets are included in the captions “Building and leasehold
improvements,” “Computer and telecommunications equipment,” and “Furniture, fixtures, vehicles, and other.”
Amortization of capital leases is included in “Depreciation” in the Consolidated Statements of Operations.
Approximately 83% in 2006 and 90% in both 2005 and 2004 of “Depreciation,” as presented in the Consolidated
Statements of Operations, was associated with the cost of providing services and products.
During the fourth quarter of 2003, the Company shortened the estimated remaining economic useful life of
its legacy TDMA wireless network to December 31, 2006 due to the expected migration of its TDMA customer
base to its Global System for Mobile Communications (“GSM”) network.
As part of the process of redeploying spectrum from the Company’s legacy TDMA wireless network to its
GSM network to meet unexpected increasing demand for its GSM services, the Company made the decision in
the first quarter of 2005 to retire certain TDMA assets in order to optimize its TDMA network performance. As a
result of this early retirement of assets, in the first quarter of 2005 the Company recorded a charge of $23.7
million under the caption “Asset impairments and other charges.” In the second quarter of 2005, the lives of
certain TDMA assets were shortened from the December 31, 2006 date being used, and depreciation was
accelerated. The change in depreciation expense due to the change in estimate in the second quarter decreased
2005 operating income and net income by $7.7 million and $4.6 million, respectively.
In the fourth quarter of 2005, due to the rapid migration of TDMA customers to the Company’s GSM
network and decreased revenue per remaining TDMA subscriber, the Company determined that the carrying
value of the TDMA assets was not recoverable from the estimated future undiscounted cash flows resulting from
68