Blackberry 2000 Annual Report Download - page 3
Download and view the complete annual report
Please find page 3 of the 2000 Blackberry annual report below. You can navigate through the pages in the report by either clicking on the pages listed below, or by using the keyword search tool below to find specific information within the annual report.-
 1
1 -
 2
2 -
 3
3 -
 4
4 -
 5
5 -
 6
6 -
 7
7 -
 8
8 -
 9
9 -
 10
10 -
 11
11 -
 12
12 -
 13
13 -
 14
14 -
15
-
16
-
17
-
18
-
19
-
20
-
21
-
22
-
23
-
24
-
25
-
26
-
27
-
28
-
29
-
30
-
31
-
32
-
33
-
34
-
35
-
36
 |
 |
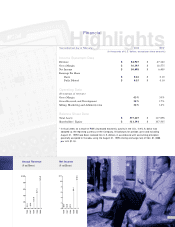
Highlights
Year ended last day of February 2000 1999*
(in thousands of U.S. dollars, except per share amounts)
Income Statement Data
Revenue $ 84,967 $ 47,342
Gross Margin $ 36,393 $ 18,575
Net Income $ 10,498 $ 6,409
Earnings Per Share
Basic $ 0.16 $ 0.10
Fully Diluted $ 0.15 $ 0.10
Operating Data
(Percentage of revenue)
Gross Margin 43% 39%
Gross Research and Development 14% 17%
Selling, Marketing and Administration 16% 14%
Balance Sheet Data
Total Assets $ 337,227 $ 117,898
Shareholders’ Equity $ 311,391 $ 107,505
*In fiscal 2000, as a result of RIM’s increased economic activity in the U.S., the U.S. dollar was
adopted as the reporting currency of the Company. All balances for periods up to and including
August 31, 1999 have been restated into U.S. dollars, in accordance with accounting principles
generally accepted in Canada, using the August 31, 1999 closing exchange rate of Cdn. $1.4888
per U.S. $1.00.
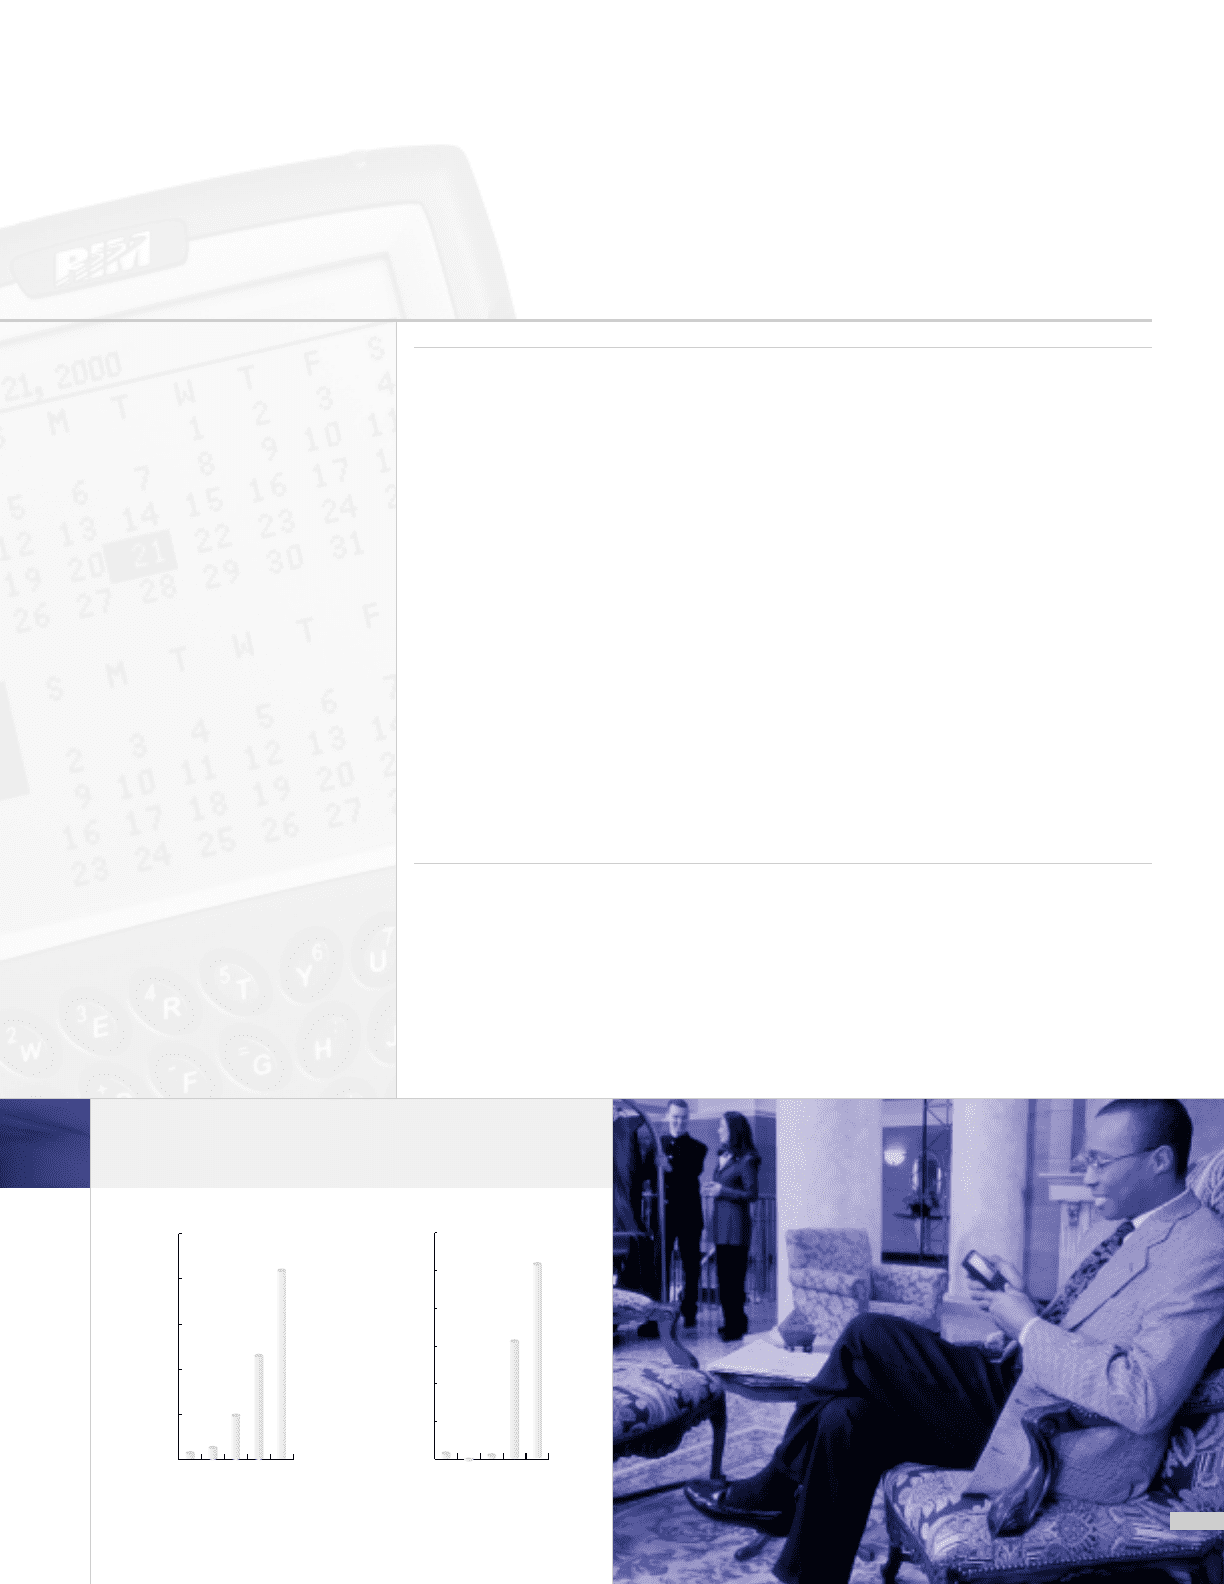
1
0
20
40
60
80
$100
1996 $4.3
1997
1998
1999
2000
$6.6
$20.9
$47.3
$85.0
Annual Revenue
($ millions)
Net Income
($ millions)
0
2
4
6
8
10
$12
1996 $0.5
1997
1998
1999
2000
$0.0
$0.4
$6.4
$10.5
Financial