Blackberry 2000 Annual Report Download - page 22
Download and view the complete annual report
Please find page 22 of the 2000 Blackberry annual report below. You can navigate through the pages in the report by either clicking on the pages listed below, or by using the keyword search tool below to find specific information within the annual report.-
 1
1 -
2
-
3
-
4
-
5
-
6
-
7
-
8
-
9
-
10
-
11
-
 12
12 -
 13
13 -
 14
14 -
 15
15 -
 16
16 -
 17
17 -
 18
18 -
 19
19 -
 20
20 -
 21
21 -
 22
22 -
 23
23 -
 24
24 -
 25
25 -
 26
26 -
 27
27 -
 28
28 -
 29
29 -
 30
30 -
 31
31 -
 32
32 -
33
-
34
-
35
-
36
 |
 |

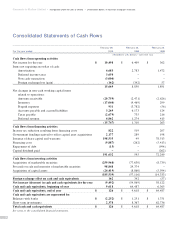
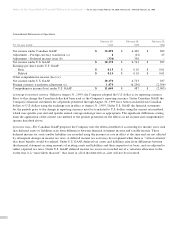
Consolidated Statements of Cash Flows
February 29, February 28, February 28,
For the year ended 2000 1999 1998
(restated in U.S. dollars – see note 1(c))
Cash flows from operating activities
Net income for the year $ 10,498 $ 6,409 $ 362
Items not requiring an outlay of cash:
Amortization 4,683 2,783 1,472
Deferred income taxes 3,650 ––
Non cash transaction (3,000) ––
Foreign exchange loss (gain) (162) (342) 57
15,669 8,850 1,891
Net changes in non-cash working capital items
related to operations:
Amounts receivable (20,759) (2,471) (2,626)
Inventory (17,040) (9,469) 299
Prepaid expenses 931 (3,782) (56)
Accounts payable and accrued liabilities 3,269 6,173 124
Taxes payable (2,679) 735 216
Deferred revenue 4,862 1,274 415
(15,747) 1,310 263
Cash flows from financing activities
Income tax reduction resulting from financing costs 822 519 207
Government funding received to offset capital asset acquisitions 2,177 289 198
Issuance of share capital and warrants 198,535 49 78,513
Financing costs (9,887) (262) (5,413)
Repayment of debt (15) – (994)
Capital dividend paid –– (262)
191,632 595 72,249
Cash flows from investing activities
Acquisition of marketable securities (259,968) (77,630) (8,739)
Proceeds on sale and maturity of marketable securities 98,848 29,374 –
Acquisition of capital assets (24,419) (8,860) (5,594)
(185,539) (57,116) (14,333)
Foreign exchange effect on cash and cash equivalents 162 342 (57)
Net increase (decrease) in cash and cash equivalents for the year (9,492) (54,869) 58,122
Cash and cash equivalents, beginning of year 9,618 64,487 6,365
Cash and cash equivalents, end of year $ 126 $ 9,618 $ 64,487
Cash and cash equivalents are represented by:
Balances with banks $ (2,252) $ 1,251 $ 1,751
Short-term investments 2,378 8,367 62,736
Total cash and cash equivalents $ 126 $ 9,618 $ 64,487
See notes to the consolidated financial statements.
20
Research In Motion Limited ■Incorporated Under the Laws of Ontario ■United States dollars, in thousands except per share data