Bed, Bath and Beyond 2010 Annual Report Download - page 30
Download and view the complete annual report
Please find page 30 of the 2010 Bed, Bath and Beyond annual report below. You can navigate through the pages in the report by either clicking on the pages listed below, or by using the keyword search tool below to find specific information within the annual report.-
 1
1 -
2
-
3
-
4
-
5
-
6
-
7
-
8
-
9
-
10
-
11
-
12
-
13
-
14
-
15
-
16
-
17
-
18
-
19
-
 20
20 -
 21
21 -
 22
22 -
 23
23 -
 24
24 -
 25
25 -
 26
26 -
 27
27 -
 28
28 -
 29
29 -
 30
30 -
 31
31 -
 32
32 -
 33
33 -
 34
34 -
 35
35 -
 36
36 -
 37
37 -
 38
38 -
 39
39 -
 40
40 -
41
-
42
-
43
-
44
-
45
-
46
-
47
-
48
-
49
-
50
-
51
-
52
-
53
-
54
-
55
-
56
-
57
-
58
-
59
-
60
-
61
-
62
-
63
-
64
-
65
-
66
-
67
-
68
 |
 |

BED BATH & BEYOND 2010 ANNUAL REPORT
28
Under the 2004 Plan and the Prior Plans, an aggregate of 83.4 million shares of common stock were authorized for issuance.
The Company generally issues new shares for stock option exercises and restricted stock awards. As of February 26, 2011,
unrecognized compensation expense related to the unvested portion of the Company’s stock options and restricted stock awards
was $21.1 million and $102.9 million, respectively, which is expected to be recognized over a weighted average period of 2.7 years
and 4.0 years, respectively.
Stock Options
Stock option grants are issued at fair market value on the date of grant and generally become exercisable in five equal annual
installments beginning one to three years from the date of grant. Option grants for stock options issued prior to May 10, 2004
expire ten years after the date of grant. Option grants for stock options issued since May 10, 2004 expire eight years after the
date of grant. All option grants are nonqualified.
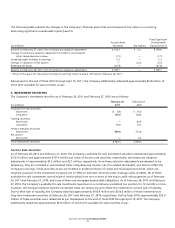
The fair value of the stock options granted was estimated on the date of the grant using a Black-Scholes option-pricing model
that uses the assumptions noted in the following table.
FISCAL YEAR ENDED
February 26, February 27, February 28,
Black-Scholes Valuation Assumptions (1) 2011 2010 2009
Weighted Average Expected Life (in years) (2) 6.1 6.3 6.1
Weighted Average Expected Volatility (3) 33.70% 40.39% 34.13%
Weighted Average Risk Free Interest Rates (4) 2.56% 2.45% 3.17%
Expected Dividend Yield — — —
(1) Forfeitures are estimated based on historical experience.
(2) The expected life of stock options is estimated based on historical experience.
(3) Expected volatility is based on the average of historical and implied volatility. The historical volatility is determined by observing actual prices
of the Company’s stock over a period commensurate with the expected life of the awards. The implied volatility represents the implied vola-
tility of the Company’s call options, which are actively traded on multiple exchanges, had remaining maturities in excess of twelve months,
had market prices close to the exercise prices of the employee stock options and were measured on the stock option grant date.
(4) Based on the U.S. Treasury constant maturity interest rate whose term is consistent with the expected life of the stock options.
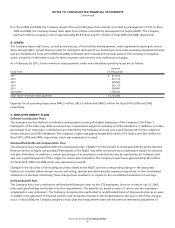
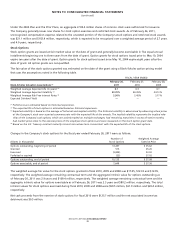
Changes in the Company’s stock options for the fiscal year ended February 26, 2011 were as follows:
Number of Weighted Average
(Shares in thousands) Stock Options Exercise Price
Options outstanding, beginning of period 13,457 $ 35.62
Granted 515 45.20
Exercised (3,804) 33.02
Forfeited or expired (33) 37.02
Options outstanding, end of period 10,135 $ 37.08
Options exercisable, end of period 7,649 $ 37.36
The weighted average fair value for the stock options granted in fiscal 2010, 2009 and 2008 was $17.05, $12.33 and $12.95,
respectively. The weighted average remaining contractual term and the aggregate intrinsic value for options outstanding as
of February 26, 2011 was 2.9 years and $109.4 million, respectively. The weighted average remaining contractual term and the
aggregate intrinsic value for options exercisable as of February 26, 2011 was 2.3 years and $80.2 million, respectively. The total
intrinsic values for stock options exercised during fiscal 2010, 2009 and 2008 were $50.5 million, $61.9 million and $20.4 million,
respectively.
Net cash proceeds from the exercise of stock options for fiscal 2010 were $125.7 million and the net associated income tax
detriment was $0.5 million.
NOTES TO CONSOLIDATED FINANCIAL STATEMENTS
(continued)