Bed, Bath and Beyond 2010 Annual Report Download - page 16
Download and view the complete annual report
Please find page 16 of the 2010 Bed, Bath and Beyond annual report below. You can navigate through the pages in the report by either clicking on the pages listed below, or by using the keyword search tool below to find specific information within the annual report.-
 1
1 -
2
-
3
-
4
-
5
-
 6
6 -
 7
7 -
 8
8 -
 9
9 -
 10
10 -
 11
11 -
 12
12 -
 13
13 -
 14
14 -
 15
15 -
 16
16 -
 17
17 -
 18
18 -
 19
19 -
 20
20 -
 21
21 -
 22
22 -
 23
23 -
 24
24 -
 25
25 -
 26
26 -
27
-
28
-
29
-
30
-
31
-
32
-
33
-
34
-
35
-
36
-
37
-
38
-
39
-
40
-
41
-
42
-
43
-
44
-
45
-
46
-
47
-
48
-
49
-
50
-
51
-
52
-
53
-
54
-
55
-
56
-
57
-
58
-
59
-
60
-
61
-
62
-
63
-
64
-
65
-
66
-
67
-
68
 |
 |

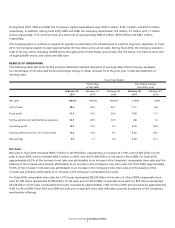
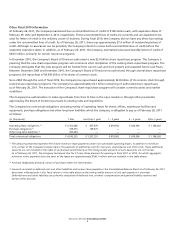
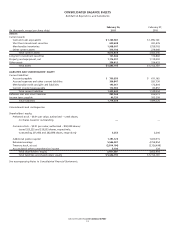
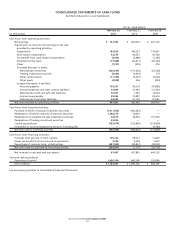
BED BATH & BEYOND 2010 ANNUAL REPORT
14
FISCAL YEAR ENDED
February 26, February 27, February 28,
(in thousands, except per share data) 2011 2010 2009
Net sales $ 8,758,503 $ 7,828,793 $ 7,208,340
Cost of sales 5,135,574 4,620,674 4,335,104
Gross profit 3,622,929 3,208,119 2,873,236
Selling, general and administrative expenses 2,334,471 2,227,432 2,199,340
Operating profit 1,288,458 980,687 673,896
Interest income 4,520 4,568 9,412
Earnings before provision for income taxes 1,292,978 985,255 683,308
Provision for income taxes 501,645 385,222 258,185
Net earnings $ 791,333 $ 600,033 $ 425,123
Net earnings per share – Basic $ 3.11 $ 2.33 $ 1.66
Net earnings per share – Diluted $ 3.07 $ 2.30 $ 1.64
Weighted average shares outstanding – Basic 254,297 257,755 256,410
Weighted average shares outstanding – Diluted 258,079 260,375 258,619
See accompanying Notes to Consolidated Financial Statements.
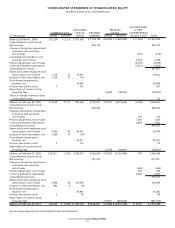
CONSOLIDATED STATEMENTS OF EARNINGS
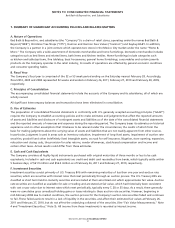
Bed Bath & Beyond Inc. and Subsidiaries