Bed, Bath and Beyond 2010 Annual Report Download - page 2
Download and view the complete annual report
Please find page 2 of the 2010 Bed, Bath and Beyond annual report below. You can navigate through the pages in the report by either clicking on the pages listed below, or by using the keyword search tool below to find specific information within the annual report.-
 1
1 -
 2
2 -
 3
3 -
 4
4 -
 5
5 -
 6
6 -
 7
7 -
 8
8 -
 9
9 -
 10
10 -
 11
11 -
 12
12 -
 13
13 -
14
-
15
-
16
-
17
-
18
-
19
-
20
-
21
-
22
-
23
-
24
-
25
-
26
-
27
-
28
-
29
-
30
-
31
-
32
-
33
-
34
-
35
-
36
-
37
-
38
-
39
-
40
-
41
-
42
-
43
-
44
-
45
-
46
-
47
-
48
-
49
-
50
-
51
-
52
-
53
-
54
-
55
-
56
-
57
-
58
-
59
-
60
-
61
-
62
-
63
-
64
-
65
-
66
-
67
-
68
 |
 |

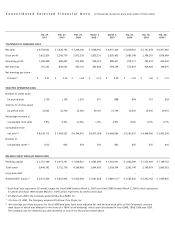
BED BATH & BEYOND 2010 ANNUAL REPORT
B
Feb. 26, Feb. 27, Feb. 28, March 1, March 3, Feb. 25, Feb. 26, Feb. 28,
2011 2010 2009 2008
(2) 2007 2006 2005 2004 (3)
STATEMENT OF EARNINGS DATA
Net sales $ 8,758,503 $ 7,828,793 $ 7,208,340 $ 7,048,942 $ 6,617,429 $ 5,809,562 $ 5,147,678 $ 4,477,981
Gross profit 3,622,929 3,208,119 2,873,236 2,925,231 2,835,402 2,485,748 2,186,301 1,876,664
Operating profit 1,288,458 980,687 673,896 838,022 889,401 879,171 792,414 639,343
Net earnings 791,333 600,033 425,123 562,808 594,244 572,847 504,964 399,470
Net earnings per share –
Diluted (4) $ 3.07 $ 2.30 $ 1.64 $ 2.10 $ 2.09 $ 1.92 $ 1.65 $ 1.31
SELECTED OPERATING DATA
Number of stores open
(at period end) 1,139 1,100 1,037 971 888 809 721 629
Total sq. ft. of store space
(at period end) 35,055 33,740 32,050 30,181 27,794 25,502 22,945 20,472
Percentage increase in
comparable store sales 7.8% 4.4% (2.4)% 1.0% 4.9% 4.6% 4.5% 6.3%
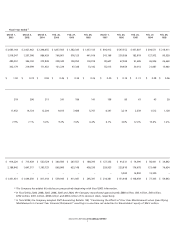
Comparable store
net sales (5) $ 8,339,112 $ 7,409,203 $ 6,746,472 $ 6,457,268 $ 6,068,694 $ 5,281,675 $ 4,468,095 $ 3,902,308
Number of
comparable stores (5) 1,013 942 874 792 683 605 535 416
BALANCE SHEET DATA (AT PERIOD END)
Working capital $ 2,751,398 $ 2,413,791 $ 1,609,831 $ 1,065,599 $ 1,553,541 $ 1,082,399 $ 1,223,409 $ 1,199,752
Total assets 5,646,193 5,152,130 4,268,843 3,844,093 3,959,304 3,382,140 3,199,979 2,865,023
Long-term debt – – – – – – – –
Shareholders’ equity (6) $ 3,931,659 $ 3,652,904 $ 3,000,454 $ 2,561,828 $ 2,649,151(7) $ 2,262,450 $ 2,203,762 $ 1,990,820
Consolidated Selected Financial Data (in thousands, except per share and number of store data)
(1) Each fiscal year represents 52 weeks, except for fiscal 2006 (ended March 3, 2007) and fiscal 2000 (ended March 3, 2001) which represents
53 weeks and fiscal 1996 (ended March 1, 1997) which represents 52 weeks and 6 days.
(2) On March 22, 2007, the Company acquired Buy Buy BABY, Inc.
(3) On June 19, 2003, the Company acquired Christmas Tree Shops, Inc.
(4) Net earnings per share amounts for fiscal 2000 and prior have been adjusted for two-for-one stock splits of the Company’s common
stock (each of which was effected in the form of a 100% stock dividend), which were distributed in fiscal 2000, 1998, 1996 and 1993.
The Company has not declared any cash dividends in any of the fiscal years noted above.