Bed, Bath and Beyond 2010 Annual Report Download - page 26
Download and view the complete annual report
Please find page 26 of the 2010 Bed, Bath and Beyond annual report below. You can navigate through the pages in the report by either clicking on the pages listed below, or by using the keyword search tool below to find specific information within the annual report.-
 1
1 -
2
-
3
-
4
-
5
-
6
-
7
-
8
-
9
-
10
-
11
-
12
-
13
-
14
-
15
-
 16
16 -
 17
17 -
 18
18 -
 19
19 -
 20
20 -
 21
21 -
 22
22 -
 23
23 -
 24
24 -
 25
25 -
 26
26 -
 27
27 -
 28
28 -
 29
29 -
 30
30 -
 31
31 -
 32
32 -
 33
33 -
 34
34 -
 35
35 -
 36
36 -
37
-
38
-
39
-
40
-
41
-
42
-
43
-
44
-
45
-
46
-
47
-
48
-
49
-
50
-
51
-
52
-
53
-
54
-
55
-
56
-
57
-
58
-
59
-
60
-
61
-
62
-
63
-
64
-
65
-
66
-
67
-
68
 |
 |

BED BATH & BEYOND 2010 ANNUAL REPORT
24
As of February 27, 2010, the Company’s trading investment securities included approximately $40.5 million at fair value ($42.8
million at par) of additional auction rate securities which were invested in securities collateralized by student loans. During the
first six months of fiscal 2010, pursuant to an agreement with the investment firm that sold the Company these securities, the
remaining $42.8 million of these securities were redeemed at par.
U.S. Treasury Securities
As of February 26, 2011 and February 27, 2010, the Company’s short term held-to-maturity securities included approximately
$599.8 million and approximately $373.6 million, respectively, of U.S. Treasury Bills with remaining maturities of less than one
year. These securities are stated at their amortized cost which approximates fair value.
Long Term Trading Investment Securities
The Company’s long term trading investment securities, which are provided as investment options to the participants of the
nonqualified deferred compensation plan, are stated at fair market value. The values of these trading investment securities
included in the table above are approximately $17.6 million and $12.1 million as of February 26, 2011 and February 27, 2010,
respectively.
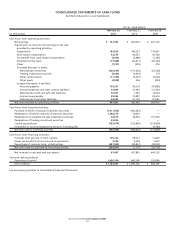
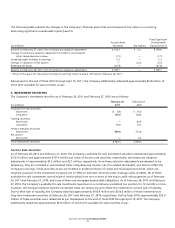
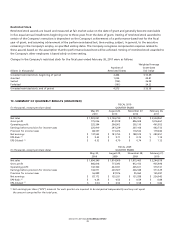
6. PROVISION FOR INCOME TAXES
The components of the provision for income taxes are as follows:
FISCAL YEAR ENDED
February 26, February 27, February 28,
(in thousands) 2011 2010 2009
Current:
Federal $ 426,956 $ 346,875 $ 233,216
State and local 90,689 61,080 47,294
517,645 407,955 280,510
Deferred:
Federal (7,698) (17,851) (19,419)
State and local (8,302) (4,882) (2,906)
(16,000) (22,733) (22,325)
$ 501,645 $ 385,222 $ 258,185
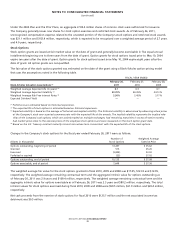
At February 26, 2011 and February 27, 2010, included in other current assets and in other assets is a net current deferred
income tax asset of $189.1 million and $167.2 million, respectively, and a net noncurrent deferred income tax asset of $90.9
million and $96.6 million, respectively. These amounts represent the net tax effects of temporary differences between the
carrying amounts of assets and liabilities for financial reporting purposes and the amounts used for income tax purposes. The
significant components of the Company’s deferred tax assets and liabilities consist of the following:
February 26, February 27,
(in thousands) 2011 2010
Deferred tax assets:
Inventories $ 26,151 $ 34,659
Deferred rent and other rent credits 75,007 64,707
Insurance 51,906 44,386
Stock-based compensation 48,743 60,994
Merchandise credits and gift card liabilities 29,043 27,409
Accrued expenses 86,927 64,388
Other 33,616 25,543
Deferred tax liabilities:
Depreciation (18,991) (15,593)
Goodwill (31,213) (25,648)
Other (21,152) (17,000)
$ 280,037 $ 263,845
NOTES TO CONSOLIDATED FINANCIAL STATEMENTS
(continued)