Bed, Bath and Beyond 2010 Annual Report Download - page 17
Download and view the complete annual report
Please find page 17 of the 2010 Bed, Bath and Beyond annual report below. You can navigate through the pages in the report by either clicking on the pages listed below, or by using the keyword search tool below to find specific information within the annual report.-
 1
1 -
2
-
3
-
4
-
5
-
6
-
 7
7 -
 8
8 -
 9
9 -
 10
10 -
 11
11 -
 12
12 -
 13
13 -
 14
14 -
 15
15 -
 16
16 -
 17
17 -
 18
18 -
 19
19 -
 20
20 -
 21
21 -
 22
22 -
 23
23 -
 24
24 -
 25
25 -
 26
26 -
 27
27 -
28
-
29
-
30
-
31
-
32
-
33
-
34
-
35
-
36
-
37
-
38
-
39
-
40
-
41
-
42
-
43
-
44
-
45
-
46
-
47
-
48
-
49
-
50
-
51
-
52
-
53
-
54
-
55
-
56
-
57
-
58
-
59
-
60
-
61
-
62
-
63
-
64
-
65
-
66
-
67
-
68
 |
 |

BED BATH & BEYOND 2010 ANNUAL REPORT
15
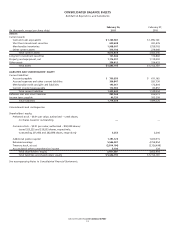
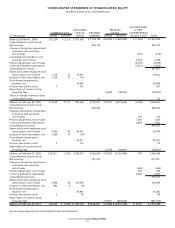
CONSOLIDATED STATEMENTS OF SHAREHOLDERS’ EQUITY
Bed Bath & Beyond Inc. and Subsidiaries
ACCUMULATED
ADDITIONAL TREASURY OTHER
COMMON STOCK PAID-IN RETAINED STOCK COMPREHENSIVE
(in thousands) SHARES AMOUNT CAPITAL EARNINGS SHARES AMOUNT INCOME (LOSS) TOTAL
Balance at March 1, 2008 312,229 $ 3,122 $ 813,568 $ 3,729,766 (53,309) $ (1,983,590) $ (1,038) $ 2,561,828
Comprehensive Income (Loss):
Net earnings 425,123 425,123
Change in temporary impairment
of auction rate securities,
net of taxes (615) (615)
Unrealized loss included in net
earnings, net of taxes 3,528 3,528
Pension adjustment, net of taxes (4,593) (4,593)
Currency translation adjustment (1,822) (1,822)
Comprehensive Income 421,621
Shares sold under employee stock
option plans, net of taxes 1,218 12 19,910 19,922
Issuance of restricted shares, net 1,224 13 (13) —
Stock-based compensation
expense, net 44,906 44,906
Director fees paid in stock 7 197 197
Repurchase of common stock,
including fees (1,668) (48,052) (48,052)
Effect of change in pension plan
measurement date 32 32
Balance at February 28, 2009 314,678 3,147 878,568 4,154,921 (54,977) (2,031,642) (4,540) 3,000,454
Comprehensive Income (Loss):
Net earnings 600,033 600,033
Change in temporary impairment
of auction rate securities,
net of taxes 325 325
Pension adjustment, net of taxes 1,260 1,260
Currency translation adjustment 3,683 3,683
Comprehensive Income 605,301
Shares sold under employee stock
option plans, net of taxes 4,503 45 96,431 96,476
Issuance of restricted shares, net 1,369 14 (14) —
Stock-based compensation
expense, net 45,411 45,411
Director fees paid in stock 3 119 119
Repurchase of common stock,
including fees (2,678) (94,857) (94,857)
Balance at February 27, 2010 320,553 3,206 1,020,515 4,754,954 (57,655) (2,126,499) 728 3,652,904
Comprehensive Income (Loss):
Net earnings 791,333 791,333
Change in temporary impairment
of auction rate securities,
net of taxes (663) (663)
Pension adjustment, net of taxes 343 343
Currency translation adjustment 4,692 4,692
Comprehensive Income 795,705
Shares sold under employee stock
option plans, net of taxes 3,804 38 125,058 125,096
Issuance of restricted shares, net 863 9 (9) —
Stock-based compensation
expense, net 45,465 45,465
Director fees paid in stock 2 94 94
Repurchase of common stock,
including fees (15,901) (687,605) (687,605)
Balance at February 26, 2011 325,222 $ 3,253 $ 1,191,123 $ 5,546,287 (73,556) $ (2,814,104) $ 5,100 $ 3,931,659
See accompanying Notes to Consolidated Financial Statements.