Bed, Bath and Beyond 2005 Annual Report Download - page 6
Download and view the complete annual report
Please find page 6 of the 2005 Bed, Bath and Beyond annual report below. You can navigate through the pages in the report by either clicking on the pages listed below, or by using the keyword search tool below to find specific information within the annual report.-
 1
1 -
 2
2 -
 3
3 -
 4
4 -
 5
5 -
 6
6 -
 7
7 -
 8
8 -
 9
9 -
 10
10 -
 11
11 -
 12
12 -
 13
13 -
 14
14 -
 15
15 -
 16
16 -
 17
17 -
18
-
19
-
20
-
21
-
22
-
23
-
24
-
25
-
26
-
27
-
28
-
29
-
30
-
31
-
32
-
33
 |
 |

BED BATH& BEYOND ANNUAL REPORT 2005
4
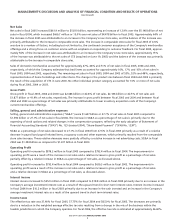
Net Sales
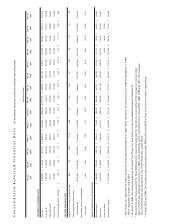
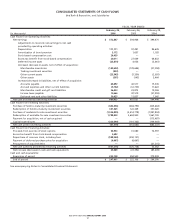
Net sales in fiscal 2005 increased $661.9 million to $5.810 billion, representing an increase of 12.9% over the $5.148 billion of net
sales in fiscal 2004, which increased $669.7 million or 15.0% over net sales of $4.478 billion in fiscal 2003. Approximately 64% of
the increase in fiscal 2005 was attributable to an increase in the Company’s new store sales, and the balance of the increase was
primarily attributable to the increase in comparable store sales. The increase in comparable store sales for fiscal 2005 of 4.6%
was due to a number of factors, including but not limited to, the continued consumer acceptance of the Company’s merchandise
offerings and a strong focus on customer service with an emphasis on responding to customer feedback. For fiscal 2004, approxi-
mately 56% of the increase in net sales was attributable to an increase in the Company’s new store sales, approximately 15%
of the increase was attributable to the net sales of CTS (acquired on June 19, 2003) and the balance of the increase was primarily
attributable to the increase in comparable store sales.
Sales of domestics merchandise accounted for approximately 47%, 48% and 51% of net sales in fiscal 2005, 2004 and 2003,
respectively, of which the Company estimates that bed linens accounted for approximately 16%, 17% and 16% of net sales in
fiscal 2005, 2004 and 2003, respectively. The remaining net sales in fiscal 2005, 2004 and 2003 of 53%, 52% and 49%, respectively,
represented sales of home furnishings and other items. The change in the product mix between fiscal 2004 and 2003 is primarily
the result of the acquisition of CTS in June 2003. No other individual product category accounted for 10% or more of net sales
during fiscal 2005, 2004 or 2003.
Gross Profit
Gross profit in fiscal 2005, 2004 and 2003 was $2.486 billion or 42.8% of net sales, $2.186 billion or 42.5% of net sales and
$1.877 billion or 41.9% of net sales, respectively. The increase in gross profit between fiscal 2005 and 2004 and between fiscal
2004 and 2003 as a percentage of net sales was primarily attributable to lower inventory acquisition costs of the Company’s
current merchandise offerings.
Selling, general and administrative expenses
Selling, general and administrative expenses (“SG&A”) were$1.607 billion or 27.7% of net sales in fiscal 2005 compared to
$1.394 billion or 27.1% of net sales in fiscal 2004. The increase in SG&A as a percentage of net sales is primarily due to the
expensing of stock options and related changes in the compensation program, reflecting the early adoption of Statement of
Financial Accounting Standards (“SFAS”) No. 123 (revised 2004), “Share-Based Payment” (“SFAS No. 123R”).
SG&A as a percentage of net sales decreased to 27.1% in fiscal 2004 from 27.6% in fiscal 2003 primarily as a result of a relative
decrease in payroll and payroll related items, occupancy costs and other expenses, which primarily resulted from the comparable
storesales increase. These relative decreases were partially offset by a relative increase in net advertising costs. SG&A in fiscal
2004 was $1.394 billion as compared to $1.237 billion in fiscal 2003.
Operating Profit
Operating profit increased to $879.2 million in fiscal 2005 compared to $792.4 million in fiscal 2004. The improvements in
operating profit were a result of the increase in net sales and a relative increase in gross profit as a percentage of net sales
partially offset by a relative increase in SG&A as a percentage of net sales, as discussed above.
Operating profitincreased to $792.4 million in fiscal 2004 compared to $639.3 million in fiscal 2003. The improvements in
operating profit were a result of the increase in net sales and a relative increase in gross profit as a percentage of net sales
and a relative decrease in SG&A as a percentage of net sales, as discussed above.
Interest income
Interest income increased to $35.9 million in fiscal 2005 compared to $18.8 million in fiscal 2004 primarily due to an increase in the
Company’s average investment interest rate as a result of the upward trend in short term interest rates. Interest income increased
in fiscal 2004 from $10.2 million in fiscal 2003 primarily due to an increase in the cash invested and an increase in the Company’s
average investment interest rate as a result of the upward trend in short term interest rates.
Income taxes
The effective tax rate was 37.40% for fiscal 2005, 37.75% for fiscal 2004 and 38.50% for fiscal 2003. The decreases are primarily
due to a reduction in the weighted average effective tax rate resulting from a change in the mix of the business within the
taxable jurisdictions in which the Company operates. For fiscal 2006, the effective tax rate is estimated at approximately 36.60%.
MANAGEMENT’S DISCUSSION AND ANALYSIS OF FINANCIAL CONDITION AND RESULTS OF OPERATIONS
(continued)