Bed, Bath and Beyond 2005 Annual Report Download - page 5
Download and view the complete annual report
Please find page 5 of the 2005 Bed, Bath and Beyond annual report below. You can navigate through the pages in the report by either clicking on the pages listed below, or by using the keyword search tool below to find specific information within the annual report.-
 1
1 -
 2
2 -
 3
3 -
 4
4 -
 5
5 -
 6
6 -
 7
7 -
 8
8 -
 9
9 -
 10
10 -
 11
11 -
 12
12 -
 13
13 -
 14
14 -
 15
15 -
 16
16 -
17
-
18
-
19
-
20
-
21
-
22
-
23
-
24
-
25
-
26
-
27
-
28
-
29
-
30
-
31
-
32
-
33
 |
 |

BED BATH& BEYOND ANNUAL REPORT 2005
3
The Company’s strategy is to achieve this objective through excellent customer service, an extensive breadth and depth of
assortment, everyday low prices, introduction of new merchandising offerings and development of its infrastructure.
Operating in the highly competitive retail industry, the Company, along with other retail companies, is influenced by a number
of factors including, but not limited to, consumer preferences and spending habits, general economic conditions, unusual weather
patterns, competition from existing and potential competitors, and the ability to find suitable locations at acceptable occupancy
costs to support the Company’s expansion program.
In fiscal 2005, the Company’s consolidated net sales increased by 12.9% and net earnings increased by 13.4%. Contributing to
this increase was the expansion of store space by 11.1%, from 22,945,000 square feet at fiscal year end 2004 to 25,502,000 square
feet at fiscal year end 2005. The 2,557,000 square feet increase was primarily the result of opening 83 BBB stores, three CTS stores
and four Harmon stores.
Comparable store sales for fiscal 2005 increased by approximately 4.6% as compared with an increase of approximately 4.5%
and 6.3% in fiscal 2004 and 2003, respectively. As of the beginning of the fiscal third quarter of 2004, CTS was included in the
calculation of comparable store sales. The fiscal 2005 increase in comparable store sales reflected a number of factors, including
but not limited to, the continued consumer acceptance of the Company’s merchandise offerings and a strong focus on customer
service with an emphasis on responding to customer feedback.
Astore is considered a comparable store when it has been open for twelve full months following its grand opening period
(typically four to six weeks). Stores relocated or expanded are excluded from comparable store sales if the change in square
footage would cause meaningful disparity in sales over the prior period. In the case of a store to be closed, such store’s sales
are not considered comparable once the store closing process has commenced.
The Company plans to continue to expand its operations and invest in its infrastructure to reach its long-term objectives.
The Company’s fiscal 2006 store opening program is expected to include approximately 80 BBB stores, six CTS stores and the
continuing development of its Harmon concept. The Company’snew storeopenings areexpected to add approximately
2.5 million square feet of store space.
Fiscal 2006 will be a 53 week period ending March 3, 2007.
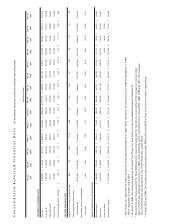
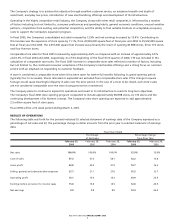
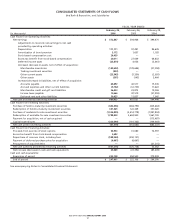
RESULTS OF OPERATIONS
The following table sets forth for the periods indicated (i) selected statement of earnings data of the Company expressed as a
percentage of net sales and (ii) the percentage change in dollar amounts from the prior year in selected statement of earnings
data:
Fiscal Year Ended
Percentage Percentage Change
of Net Sales from Prior Year
February 25, February 26, February 28, February 25, February 26,
2006 2005 2004 2006 2005
Net sales 100.0% 100.0% 100.0% 12.9% 15.0%
Cost of sales 57.2 57.5 58.1 12.2 13.8
Gross profit 42.8 42.5 41.9 13.7 16.5
Selling, general and administrative expenses 27.7 27.1 27.6 15.3 12.7
Operating profit 15.1 15.4 14.3 10.9 23.9
Earnings beforeprovision for income taxes 15.8 15.8 14.5 12.8 24.9
Net earnings 9.9 9.8 8.9 13.4 26.4