Bed, Bath and Beyond 2005 Annual Report Download - page 27
Download and view the complete annual report
Please find page 27 of the 2005 Bed, Bath and Beyond annual report below. You can navigate through the pages in the report by either clicking on the pages listed below, or by using the keyword search tool below to find specific information within the annual report.-
 1
1 -
2
-
3
-
4
-
5
-
6
-
7
-
8
-
9
-
10
-
11
-
12
-
13
-
14
-
15
-
16
-
 17
17 -
 18
18 -
 19
19 -
 20
20 -
 21
21 -
 22
22 -
 23
23 -
 24
24 -
 25
25 -
 26
26 -
 27
27 -
 28
28 -
 29
29 -
 30
30 -
 31
31 -
 32
32 -
 33
33
 |
 |

BED BATH& BEYOND ANNUAL REPORT 2005
25
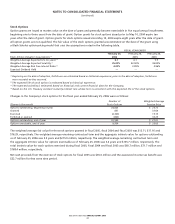
Restricted Stock
Restricted stock awards are issued and measured at market value on the date of grant and generally become exercisable in five
equal annual installments beginning one to three years from the date of grant.
Vesting of restricted stock awarded to certain of the Company’s executives is dependent on the Company’s achievement of a
performance-based test for the fiscal year of grant, and assuming achievement of the performance-based test, time vesting,
subject, in general, to the executive remaining in the Company’s employ on specified vesting dates. The Company recognizes
compensation expense related to these awards based on the assumption that the performance-based test will be achieved.
Vesting of restricted stock awarded to the Company’s other employees is based solely on time vesting.
Changes in the Company’s restricted stock for the fiscal year ended February 25, 2006 were as follows:
Weighted
Number of Average Grant –
(Shares in thousands) Restricted Shares Date Fair Value
Unvested restricted stock, beginning of year —)$—%
Granted 1,072)37.00%
Vested —)—%
Forfeited (41) 37.12%
Unvested restricted stock, end of year 1,031)$ 37.00%
13. SUMMARY OF QUARTERLY RESULTS (UNAUDITED)
FISCAL 2005
(in thousands, except per share data) QUARTER ENDED
May 28, August 27, November 26, February 25,
2005 2005 2005 2006
Net sales $ 1,244,421 $ 1,431,182 $ 1,448,680 $ 1,685,279
Gross profit 520,781 601,784 615,363 747,820
Operating profit 150,884 217,877 205,493 304,917
Earnings before provision
for income taxes 157,992 225,882 215,048 316,169
Provision for income taxes 59,089 84,480 80,428 118,247
Net earnings $ 98,903 $ 141,402 $ 134,620 $ 197,922
EPS-Basic (1) $ 0.34 $ 0.48 $ 0.45 $ 0.68
EPS-Diluted (1) $ 0.33 $ 0.47 $ 0.45 $ 0.67
FISCAL 2004
(in thousands, except per sharedata) QUARTER ENDED
May 29, August 28, November 27, February 26,
2004 2004 2004 2005
Net sales $ 1,100,917 $ 1,273,960 $ 1,305,155 $ 1,467,646
Gross profit 456,774 530,829 548,152 650,546
Operating profit 128,707 189,108 190,978 283,621
Earnings beforeprovision
for income taxes 131,805 192,784 195,867 290,731
Provision for income taxes 49,756 72,776 73,940 109,751
Net earnings $ 82,049 $ 120,008 $ 121,927 $ 180,980
EPS-Basic (1) $ 0.27 $ 0.40 $ 0.40 $ 0.60
EPS-Diluted (1) $ 0.27 $ 0.39 $ 0.40 $ 0.59
(1) Net earnings per share (“EPS”) amounts for each quarter are required to be computed independently and may not equal the amount
computed for the total year.