Bed, Bath and Beyond 2003 Annual Report Download - page 6
Download and view the complete annual report
Please find page 6 of the 2003 Bed, Bath and Beyond annual report below. You can navigate through the pages in the report by either clicking on the pages listed below, or by using the keyword search tool below to find specific information within the annual report.-
 1
1 -
 2
2 -
 3
3 -
 4
4 -
 5
5 -
 6
6 -
 7
7 -
 8
8 -
 9
9 -
 10
10 -
 11
11 -
 12
12 -
 13
13 -
 14
14 -
 15
15 -
 16
16 -
 17
17 -
18
-
19
-
20
-
21
-
22
-
23
-
24
-
25
-
26
-
27
 |
 |

BED BATH& BEYOND ANNUAL REPORT 2003
4
Net Sales
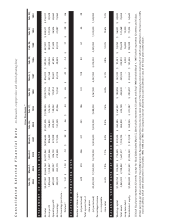
Net sales in fiscal 2003 increased $812.8 million to $4.478 billion, representing an increase of 22.2% over the $3.665
billion of net sales in fiscal 2002, which increased $737.2 million or 25.2% over net sales of $2.928 billion in
fiscal 2001. Approximately 41% of the increase in fiscal 2003 was attributable to BBB new store sales and 34% of the
increase was attributable to the net sales of CTS, which was acquired in June 2003. The increase in comparable store
sales for fiscal 2003 of 6.3% was due to a number of factors, including but not limited to, the continued consumer
acceptance of the Company’s merchandise offerings, a strong focus on customer service and the continued success of
the Company’s advertising program. For fiscal 2002, new store sales contributed approximately 68% to the increase in
net sales and the balance to an increase in comparable store sales and the acquisition of Harmon in March 2002.
Sales of domestics merchandise accounted for approximately 51%, 55% and 54% of net sales in fiscal 2003, 2002 and
2001, respectively, of which the Company estimates that bed linens accounted for approximately 16%, 19% and 19%
of net sales in fiscal 2003, 2002 and 2001, respectively. The remaining net sales in fiscal 2003, 2002 and 2001
of 49%, 45% and 46%, respectively, represented sales of home furnishings. The change in the product mix between
fiscal 2003 and 2002 is primarily the result of the acquisition of CTS. No other individual product category accounted
for 10% or more of net sales during fiscal 2003, 2002 or 2001.
Gross Profit
Gross profit in fiscal 2003, 2002 and 2001 was $1.877 billion or 41.9% of net sales, $1.519 billion or 41.4% of net sales
and $1.208 billion or 41.2% of net sales, respectively. The increase in gross profit between fiscal 2003 and 2002 as a
percentage of net sales was primarily attributable to improvements in both the markup and in markdowns taken.
The slight increase in gross profit between fiscal 2002 and 2001 was the result of improvements in markup on the mix
of product purchased in fiscal 2002 offset by the relative increase in markdowns recorded in fiscal 2002 as compared
to fiscal 2001.
Selling, General and Administrative Expenses
Selling, general and administrative expenses (“SG&A”) were $1.237 billion or 27.6% of net sales in fiscal 2003 com-
pared to $1.038 billion or 28.3% of net sales in fiscal 2002. The decrease in SG&A as a percentage of net sales
primarily reflects a decrease in occupancy costs, other store expenses and costs associated with new store openings,
partially offset by an increase in litigation expense and net advertising costs. Store opening and expansion costs are
charged to earnings as incurred.
SG&A as a percentage of net sales decreased to 28.3% in fiscal 2002 from 29.4% in fiscal 2001 primarily as a result of
a decrease in occupancy costs and costs associated with new store openings, partially offset by an increase in payroll
and payroll related items. SG&A in fiscal 2002 was $1.038 billion as compared to $861.5 million in fiscal 2001.
Interest Income
Interest income decreased to $10.2 million in fiscal 2003 compared to $11.3 million in fiscal 2002 due to a decrease
in the average investment interest rate partially offset by an increase in cash invested. However, interest income
increased in fiscal 2002 from $11.0 million in fiscal 2001 due to the increase in invested cash partially offset by a
decrease in the average investment rate.
Income Taxes
The effective tax rate was 38.5% for fiscal 2003, 2002 and 2001 due to the weighted average effective tax rate
remaining consistent in the states and territory in which the Company currently conducts business.
MANAGEMENT’S DISCUSSION AND ANALYSIS OF FINANCIAL CONDITION AND RESULTS OF OPERATIONS
(continued)