Bed, Bath and Beyond 2003 Annual Report Download - page 12
Download and view the complete annual report
Please find page 12 of the 2003 Bed, Bath and Beyond annual report below. You can navigate through the pages in the report by either clicking on the pages listed below, or by using the keyword search tool below to find specific information within the annual report.-
 1
1 -
 2
2 -
 3
3 -
 4
4 -
 5
5 -
 6
6 -
 7
7 -
 8
8 -
 9
9 -
 10
10 -
 11
11 -
 12
12 -
 13
13 -
 14
14 -
 15
15 -
 16
16 -
 17
17 -
 18
18 -
 19
19 -
 20
20 -
 21
21 -
 22
22 -
23
-
24
-
25
-
26
-
27
 |
 |

BED BATH& BEYOND ANNUAL REPORT 2003
10
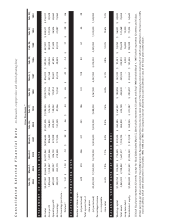
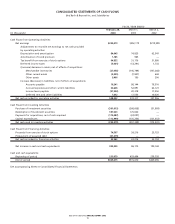
FISCAL YEAR ENDED
February 28, March 1, March 2,
(in thousands) 2004 2003 2002
Cash Flows from Operating Activities:
Net earnings $399,470)$302,179 $219,599
Adjustments to reconcile net earnings to net cash provided
by operating activities:
Depreciation and amortization 84,645)74,825)62,547)
Amortization of bond premium 1,185)985)—)
Tax benefit from exercise of stock options 64,832)31,176)31,980)
Deferred income taxes (3,061) (13,291) 1,733)
(Increase) decrease in assets, net of effects of acquisitions:
Merchandise inventories (27,058) (145,789) (147,268)
Other current assets (2,055) (7,927) 644)
Other assets 5,466)190)206)
Increase (decrease) in liabilities, net of effects of acquisitions:
Accounts payable 19,341)86,144)78,516)
Accrued expenses and other current liabilities 36,628)52,891)62,123)
Income taxes payable (37,993) 20,378)17,450)
Deferred rent and other liabilities 7,042)17,556)10,426)
Net cash provided by operating activities 548,442)419,317)337,956)
Cash Flows from Investing Activities:
Purchase of investment securities (361,013) (368,008) (51,909)
Redemption of investment securities 357,020)170,000)—)
Payments for acquisitions, net of cash acquired (175,487) (24,097) —)
Capital expenditures (112,999) (135,254) (121,632)
Net cash used in investing activities (292,479) (357,359) (173,541)
Cash Flows from Financing Activities:
Proceeds from exercise of stock options 74,597)24,216)25,753)
Prepayment of acquired debt (21,215) —)—)
Net cash provided by financing activities 53,382)24,216)25,753)
Net increase in cash and cash equivalents 309,345)86,174)190,168)
Cash and cash equivalents:
Beginning of period 515,670)429,496)239,328)
End of period $825,015)$515,670)$429,496)
See accompanying Notes to Consolidated Financial Statements.
CONSOLIDATED STATEMENTS OF CASH FLOWS
Bed Bath & Beyond Inc. and Subsidiaries