Bed, Bath and Beyond 2003 Annual Report Download - page 5
Download and view the complete annual report
Please find page 5 of the 2003 Bed, Bath and Beyond annual report below. You can navigate through the pages in the report by either clicking on the pages listed below, or by using the keyword search tool below to find specific information within the annual report.-
 1
1 -
 2
2 -
 3
3 -
 4
4 -
 5
5 -
 6
6 -
 7
7 -
 8
8 -
 9
9 -
 10
10 -
 11
11 -
 12
12 -
 13
13 -
 14
14 -
 15
15 -
 16
16 -
17
-
18
-
19
-
20
-
21
-
22
-
23
-
24
-
25
-
26
-
27
 |
 |

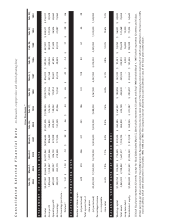
BED BATH& BEYOND ANNUAL REPORT 2003
3
OVERVIEW
In fiscal 2003, the Company’s consolidated net sales increased by 22.2% and net earnings increased by 32.2%.
Contributing to this increase was the expansion of Bed Bath & Beyond (“BBB”) store space by 12.2%, from 17,255,000
square feet at fiscal year end 2002 to 19,353,000 square feet at fiscal year end 2003. The 2,098,000 square feet
increase was primarily the result of opening 85 new BBB stores and relocating two existing stores. In fiscal 2002, the
Company expanded BBB store space by 17.2%, or 2,531,000 square feet, from 14,724,000 square feet at fiscal year
end 2001. The 2,531,000 square feet increase was the result of opening 95 new stores offset by the closing of one
small store.
Also contributing to these increases in fiscal 2003 and 2002 were two acquisitions made by the Company.
In June 2003, the Company acquired Christmas Tree Shops, Inc. (“CTS”) for approximately $194.4 million, net of
cash acquired, plus the costs of the acquisition, which includes $175.5 million of cash and $18.9 million in deferred
payments payable in cash over the next three years. CTS is a retailer of giftware and household items selling a broad
assortment of domestics merchandise and home furnishings at low prices in many categories including home décor,
giftware, housewares, food, paper goods, and seasonal products. CTS’ results of operations are included in the
Company’s consolidated results of operations since the date of acquisition. In March 2002, the Company acquired
Harmon Stores, Inc. (“Harmon”), a health and beauty care retailer, for approximately $24.1 million, net of cash
acquired. Harmon’s results of operations are included in the Company’s consolidated results of operations since the
date of acquisition. On a combined basis, CTS and Harmon store space totaled 1,119,000 square feet at February 28,
2004.
Comparable store sales for fiscal 2003 increased by approximately 6.3% as compared with an increase of approximately
7.9% and 7.1% in fiscal 2002 and 2001, respectively. The fiscal 2003 increase in comparable store sales reflected a
number of factors, including but not limited to, the continued consumer acceptance of the Company’s merchandise
offerings, a strong focus on customer service and the continued success of the Company’s advertising program.
The Company plans to continue to expand its operations and invest in its infrastructure to reach its long-term
objectives.
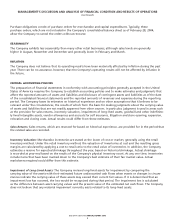
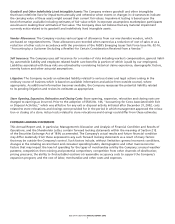
RESULTS OF OPERATIONS
The following table sets forth for the periods indicated (i) selected statement of earnings data of the Company
expressed as a percentage of net sales and (ii) the percentage change in dollar amounts from the prior year in
selected statement of earnings data:
Fiscal Year Ended
Percentage Percentage Change
of Net Sales from Prior Year
February 28, March 1, March 2, February 28, March 1,
2004 2003 2002 2004 2003
Net sales 100.0% 100.0% 100.0% 22.2% 25.2%
Cost of sales 58.1%58.6%58.8%21.2%24.8%
Gross profit 41.9%41.4%41.2%23.6%25.8%
Selling, general and administrative expenses 27.6%28.3%29.4%19.1%20.5%
Operating profit 14.3%13.1%11.8%33.2%38.7%
Earnings before provision for income taxes 14.5%13.4%12.2%32.2%37.6%
Net earnings 8.9%8.2%7.5%32.2%37.6%
MANAGEMENT’S DISCUSSION AND ANALYSIS OF FINANCIAL CONDITION AND RESULTS OF OPERATIONS