Bed, Bath and Beyond 2003 Annual Report Download - page 23
Download and view the complete annual report
Please find page 23 of the 2003 Bed, Bath and Beyond annual report below. You can navigate through the pages in the report by either clicking on the pages listed below, or by using the keyword search tool below to find specific information within the annual report.-
 1
1 -
2
-
3
-
4
-
5
-
6
-
7
-
8
-
9
-
10
-
11
-
12
-
 13
13 -
 14
14 -
 15
15 -
 16
16 -
 17
17 -
 18
18 -
 19
19 -
 20
20 -
 21
21 -
 22
22 -
 23
23 -
 24
24 -
 25
25 -
 26
26 -
 27
27
 |
 |

BED BATH& BEYOND ANNUAL REPORT 2003
21
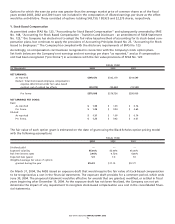
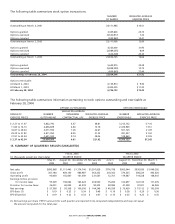
The following table summarizes stock option transactions:
NUMBER WEIGHTED-AVERAGE
OF SHARES EXERCISE PRICE
Outstanding at March 3, 2001 24,171,985)$10.51
Options granted 3,439,800)23.73
Options exercised (3,550,917) 7.25
Options canceled (943,860) 14.41
Outstanding at March 2, 2002 23,117,008)12.80
Options granted 4,335,000)31.95
Options exercised (2,989,255) 8.09
Options canceled (626,008) 20.45
Outstanding at March 1, 2003 23,836,745)16.66
Options granted 5,655,975)35.28
Options exercised (5,848,349) 12.75
Options canceled (609,865) 27.46
Outstanding at February 28, 2004 23,034,506)$21.92
Options exercisable:
At March 2, 2002 6,155,914)$9.30
At March 1, 2003 8,404,205)$11.20
At February 28, 2004 6,706,123)$12.45
The following table summarizes information pertaining to stock options outstanding and exercisable at
February 28, 2004:
OPTIONS OUTSTANDING OPTIONS EXERCISABLE
WEIGHTED-AVERAGE
RANGE OF NUMBER REMAINING WEIGHTED-AVERAGE NUMBER WEIGHTED-AVERAGE
EXERCISE PRICES OUTSTANDING CONTRACTUAL LIFE EXERCISE PRICE EXERCISABLE EXERCISE PRICE
$2.37 to 11.47 5,832,792 4.47 $8.81 3,213,752 $ 7.16
11.83 to 16.13 4,696,809 4.80 13.78 2,474,949 13.51
16.81 to 28.34 3,071,935 7.00 22.67 507,125 21.09
29.29 to 31.83 5,811,950 8.45 31.23 381,437 31.52
31.91 to 42.54 3,621,020 9.14 38.06 128,860 33.55
$2.37 to 42.54 23,034,506 6.61 $21.92 6,706,123 $12.45
13. SUMMARY OF QUARTERLY RESULTS (UNAUDITED)
FISCAL 2003 FISCAL 2002
(in thousands, except per share data) QUARTER ENDED QUARTER ENDED
May 31, August 30, November 29, February 28, June 1, August 31, November 30, March 1,
2003 2003 2003 2004 2002 2002 2002 2003
Net sales $893,868 $1,111,445 $1,174,740 $1,297,928 $776,798 $903,044 $936,030 $1,049,292
Gross profit 367,180 459,145 486,987 563,352 318,362 370,335 386,224 443,626
Operating profit 90,450 155,867 161,459 231,567 72,701 119,687 119,228 168,441
Earnings before provision
for income taxes 93,509 158,062 163,424 234,550 75,283 122,697 122,133 171,235
Provision for income taxes 36,001 60,854 62,918 90,302 28,984 47,238 47,021 65,926
Net earnings $ 57,508 $ 97,208 $ 100,506 $ 144,248 $ 46,299 $ 75,459 $ 75,112 $ 105,309
EPS-Basic (1) $ 0.19 $ 0.33 $ 0.34 $ 0.48 $ 0.16 $ 0.26 $ 0.26 $ 0.36
EPS-Diluted (1) $ 0.19 $ 0.32 $ 0.33 $ 0.47 $ 0.15 $ 0.25 $ 0.25 $ 0.35
(1) Net earnings per share (“EPS”) amounts for each quarter are required to be computed independently and may not equal
the amount computed for the total year.