Bed, Bath and Beyond 2003 Annual Report Download - page 11
Download and view the complete annual report
Please find page 11 of the 2003 Bed, Bath and Beyond annual report below. You can navigate through the pages in the report by either clicking on the pages listed below, or by using the keyword search tool below to find specific information within the annual report.-
 1
1 -
 2
2 -
 3
3 -
 4
4 -
 5
5 -
 6
6 -
 7
7 -
 8
8 -
 9
9 -
 10
10 -
 11
11 -
 12
12 -
 13
13 -
 14
14 -
 15
15 -
 16
16 -
 17
17 -
 18
18 -
 19
19 -
 20
20 -
 21
21 -
 22
22 -
23
-
24
-
25
-
26
-
27
 |
 |

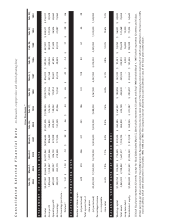
BED BATH& BEYOND ANNUAL REPORT 2003
9
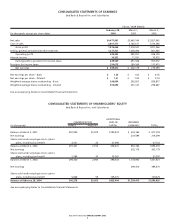
FISCAL YEAR ENDED
February 28, March 1, March 2,
(in thousands, except per share data) 2004 2003 2002
Net sales $4,477,981 $3,665,164 $2,927,962
Cost of sales 2,601,317 2,146,617 1,720,396
Gross profit 1,876,664 1,518,547 1,207,566
Selling, general and administrative expenses 1,237,321 1,038,490 861,466
Operating profit 639,343 480,057 346,100
Interest income 10,202 11,291 10,972
Earnings before provision for income taxes 649,545 491,348 357,072
Provision for income taxes 250,07
Net earnings $399,470 $302,179 $ 219,599
Net earnings per share - Basic $1.35 $1.03 $ 0.76
Net earnings per share - Diluted $1.31 $1.00 $ 0.74
Weighted average shares outstanding - Basic 296,854 292,927 289,877
Weighted average shares outstanding - Diluted 304,690 301,147 298,667
See accompanying Notes to Consolidated Financial Statements.
CONSOLIDATED STATEMENTS OF EARNINGS
Bed Bath & Beyond Inc. and Subsidiaries
CONSOLIDATED STATEMENTS OF SHAREHOLDERS' EQUITY
Bed Bath & Beyond Inc. and Subsidiaries
ADDITIONAL
COMMON STOCK PAID-IN RETAINED
(in thousands) SHARES AMOUNT CAPITAL EARNINGS TOTAL
Balance at March 3, 2001 287,890 $2,879 $180,974 $ 633,165 $ 817,018
Net earnings 219,599 219,599
Shares sold under employee stock option
plans, including tax benefit 3,551 35 57,698 57,733
Balance at March 2, 2002 291,441 2,914 238,672 852,764 1,094,350
Net earnings 302,179 302,179
Shares sold under employee stock option
plans, including tax benefit 2,989 30 55,362 55,392
Balance at March 1, 2003 294,430 2,944 294,034 1,154,943 1,451,921
Net earnings 399,470 399,470
Shares sold under employee stock option
plans, including tax benefit 5,848 59 139,370 139,429
Balance at February 28, 2004 300,278 $3,003 $433,404 $1,554,413 $1,990,820
See accompanying Notes to Consolidated Financial Statements.
5 189,169 137,473