Airtran 2009 Annual Report Download - page 66
Download and view the complete annual report
Please find page 66 of the 2009 Airtran annual report below. You can navigate through the pages in the report by either clicking on the pages listed below, or by using the keyword search tool below to find specific information within the annual report.-
 1
1 -
2
-
3
-
4
-
5
-
6
-
7
-
8
-
9
-
10
-
11
-
12
-
13
-
14
-
15
-
16
-
17
-
18
-
19
-
20
-
21
-
22
-
23
-
24
-
25
-
26
-
27
-
28
-
29
-
30
-
31
-
32
-
33
-
34
-
35
-
36
-
37
-
38
-
39
-
40
-
41
-
42
-
43
-
44
-
45
-
46
-
47
-
48
-
49
-
50
-
51
-
52
-
53
-
54
-
55
-
 56
56 -
 57
57 -
 58
58 -
 59
59 -
 60
60 -
 61
61 -
 62
62 -
 63
63 -
 64
64 -
 65
65 -
 66
66 -
 67
67 -
 68
68 -
 69
69 -
 70
70 -
 71
71 -
 72
72 -
 73
73 -
 74
74 -
 75
75 -
 76
76 -
77
-
78
-
79
-
80
-
81
-
82
-
83
-
84
-
85
-
86
-
87
-
88
-
89
-
90
-
91
-
92
-
93
-
94
-
95
-
96
-
97
-
98
-
99
-
100
-
101
-
102
-
103
-
104
-
105
-
106
-
107
-
108
-
109
-
110
-
111
-
112
-
113
-
114
-
115
-
116
-
117
-
118
-
119
-
120
-
121
-
122
-
123
-
124
-
125
-
126
-
127
-
128
-
129
-
130
-
131
-
132
 |
 |

57
Jet fuel prices reached record high levels during 2008 and were volatile during 2009 and 2008. The following
table summarizes our fuel expense (including taxes and into-plane fees), gallons of fuel burned and average cost
per gallon (including taxes and into-plane fees) during 2009, 2008 and 2007 (in thousands, except average cost
per gallon amounts):
Three Months Ended
March 31 June 30 September 30 December 31 Annual
2009
Gallons burned 83,352 92,813 96,098 90,952 363,215
Average cost per gallon $ 1.59 $ 1.72 $ 1.98 $ 2.15 $ 1.87
Aircraft fuel expense $ 132,870 $ 159,903 $ 190,235 $ 195,827 $ 678,835
2008
Gallons burned 89,605 98,261 95,303 84,000 367,169
Average cost per gallon $ 3.00 $ 3.75 $ 3.82 $ 2.32 $ 3.25
Aircraft fuel expense $ 268,442 $ 368,127 $ 363,882 $ 194,487 $ 1,194,938
2007
Gallons burne
d
82,679 91,433 95,339 90,308 359,759
Avera
g
e cost
p
er
g
allo
n
$ 2.01 $ 2.20 $ 2.25 $ 2.45 $ 2.23
Aircraft fuel expense $ 166,080 $ 201,588 $ 214,867 $ 221,105 $ 803,640
We enter into fuel-related derivative financial instruments with financial institutions to reduce the ultimate
variability of cash flows associated with fluctuations in jet fuel prices. We do not hold or issue derivative
financial instruments for trading purposes. The financial accounting for fuel-related derivatives is discussed in
ITEM 8. “FINANCIAL STATEMENTS AND SUPPLEMENTARY DATA, Note 3 – Financial Instruments”.
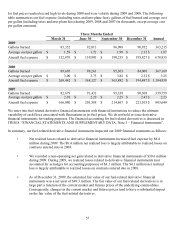
In summary, our fuel-related derivative financial instruments impacted our 2009 financial statements as follows:
•
N
et realized losses related to derivative financial instruments increased fuel expense by $8.4
million during 2009. The $8.4 million net realized loss is largely attributable to realized losses on
contracts entered into in 2008.
• We recorded a non-operating net gain related to derivative financial instruments of $30.6 million
during 2009. During 2009, we realized losses related to derivative financial instruments (not
accounted for as hedges for accounting purposes) of $4.1 million. The $4.1 million net realized
loss is largely attributable to realized losses on contracts entered into in 2008.
• As of December 31, 2009, the estimated fair value of our fuel-related derivative financial
instruments was a net asset of $49.3 million. The fair value of our fuel-related derivatives is in
large part a function of the current market and futures prices of the underlying commodities.
Consequently, changes in the current market and futures prices tend to have a substantial impact
on the fair value of the fuel-related derivatives.