Airtran 2009 Annual Report Download - page 40
Download and view the complete annual report
Please find page 40 of the 2009 Airtran annual report below. You can navigate through the pages in the report by either clicking on the pages listed below, or by using the keyword search tool below to find specific information within the annual report.-
 1
1 -
2
-
3
-
4
-
5
-
6
-
7
-
8
-
9
-
10
-
11
-
12
-
13
-
14
-
15
-
16
-
17
-
18
-
19
-
20
-
21
-
22
-
23
-
24
-
25
-
26
-
27
-
28
-
29
-
 30
30 -
 31
31 -
 32
32 -
 33
33 -
 34
34 -
 35
35 -
 36
36 -
 37
37 -
 38
38 -
 39
39 -
 40
40 -
 41
41 -
 42
42 -
 43
43 -
 44
44 -
 45
45 -
 46
46 -
 47
47 -
 48
48 -
 49
49 -
 50
50 -
51
-
52
-
53
-
54
-
55
-
56
-
57
-
58
-
59
-
60
-
61
-
62
-
63
-
64
-
65
-
66
-
67
-
68
-
69
-
70
-
71
-
72
-
73
-
74
-
75
-
76
-
77
-
78
-
79
-
80
-
81
-
82
-
83
-
84
-
85
-
86
-
87
-
88
-
89
-
90
-
91
-
92
-
93
-
94
-
95
-
96
-
97
-
98
-
99
-
100
-
101
-
102
-
103
-
104
-
105
-
106
-
107
-
108
-
109
-
110
-
111
-
112
-
113
-
114
-
115
-
116
-
117
-
118
-
119
-
120
-
121
-
122
-
123
-
124
-
125
-
126
-
127
-
128
-
129
-
130
-
131
-
132
 |
 |

31
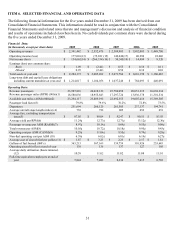
ITEM 6. SELECTED FINANCIAL AND OPERATING DATA
The following financial information for the five years ended December 31, 2009 has been derived from our
Consolidated Financial Statements. This information should be read in conjunction with the Consolidated
Financial Statements and related notes thereto and management’s discussion and analysis of financial condition
and results of operations included elsewhere herein. No cash dividends per common share were declared during
the five years ended December 31, 2009.
F
inancia
l
D
ata:
(in thousands, except per share data) 2009 2008 2007
2006 2005
Operating revenues $2,341,442 $2,552,478
$
2,309,983
$
1,892,083 $1,449,700
Operating income (loss) 177,010(13) (75,821)(15) 142,646(17) 40,294 22,646
N
et income
(
loss
)
$134,662
(
14
)
$
(
266,334
)
(
16
)
$
50,545
(
18
)
$
14,494 $9,320
Earnings (loss) per common share:
Basic $1.09 $
(
2.44
)
$
0.55
$
0.16 $0.11
Diluted 0.95
(
2.44
)
0.54 0.16 0.10
Total assets at year-end $2,284,172 $2,085,262
$
2,071,784
$
1,616,159 $1,160,483
Long-term debt and capital lease obligations
includin
g
current maturities at
y
ea
r
-en
d
$1,214,017 $1,104,056
$
1,037,246
$
784,093 $440,091
O
p
eratin
g
Data:
Revenue passengers 23,997,810 24,619,120 23,780,058 20,051,219 16,638,214
Revenue passenger miles (RPM) (000s)(1) 18,588,036 18,955,843 17,297,724 13,836,378 11,301,534
Available seat miles (ASM) (000s)(2) 23,294,117 23,809,190 22,692,355 19,007,416 15,369,505
Passenger load factor(3) 79.8%79.6%76.2%72.8%73.5%
Departures 251,694 260,120 261,505 237,137 194,741
Avera
g
e aircraft sta
g
e len
g
th
(
miles
)(
4
)
738 728 695 652 651
Average fare, excluding transportation
taxes
(
5
)
$87.05 $98.04
$
92.47
$
90.51 $83.93
Average yield per RPM(6) 11.24¢12.73¢12.71¢13.12¢12.36¢
Passenger revenue per ASM (RASM)(7) 8.97¢10.14¢9.69¢9.55¢9.09¢
Total revenue per ASM(8) 10.05¢10.72¢10.18¢9.95¢9.43¢
Operating cost per ASM (CASM)(9) 9.29¢11.04¢9.55¢9.74¢9.28¢
Non-fuel operating cost per ASM (10) 6.38¢6.02¢6.01¢6.19¢6.27¢
Average cost of aircraft fuel per gallon (11) $1.87 $3.25
$
2.23
$
2.17 $1.81
Gallons of fuel burned (000’s) 363,215 367,169 359,759 310,926 255,643
Operating aircraft in fleet at end of year 138 136 137 127 105
Average daily utilization (hours:minutes)
(12) 10:59 11:02 11:02 11:08 11:01
Full-time equivalent employees at end of
year 7,844 7,489 8,236 7,415 6,703